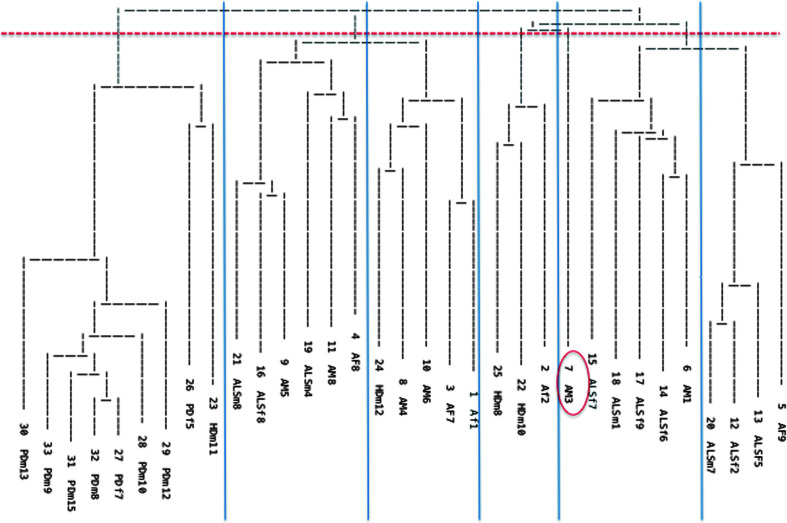
Figure 3.
Dendogram derived from the cluster analysis. The dotted line corresponds to the solution selected for the present analysis. The solid lines demarcate cluster boundaries. One speaker, AM3 (circled in the figure), was not included in subsequent cluster-based analyses because of his late cluster linking.

