
Figure 1:
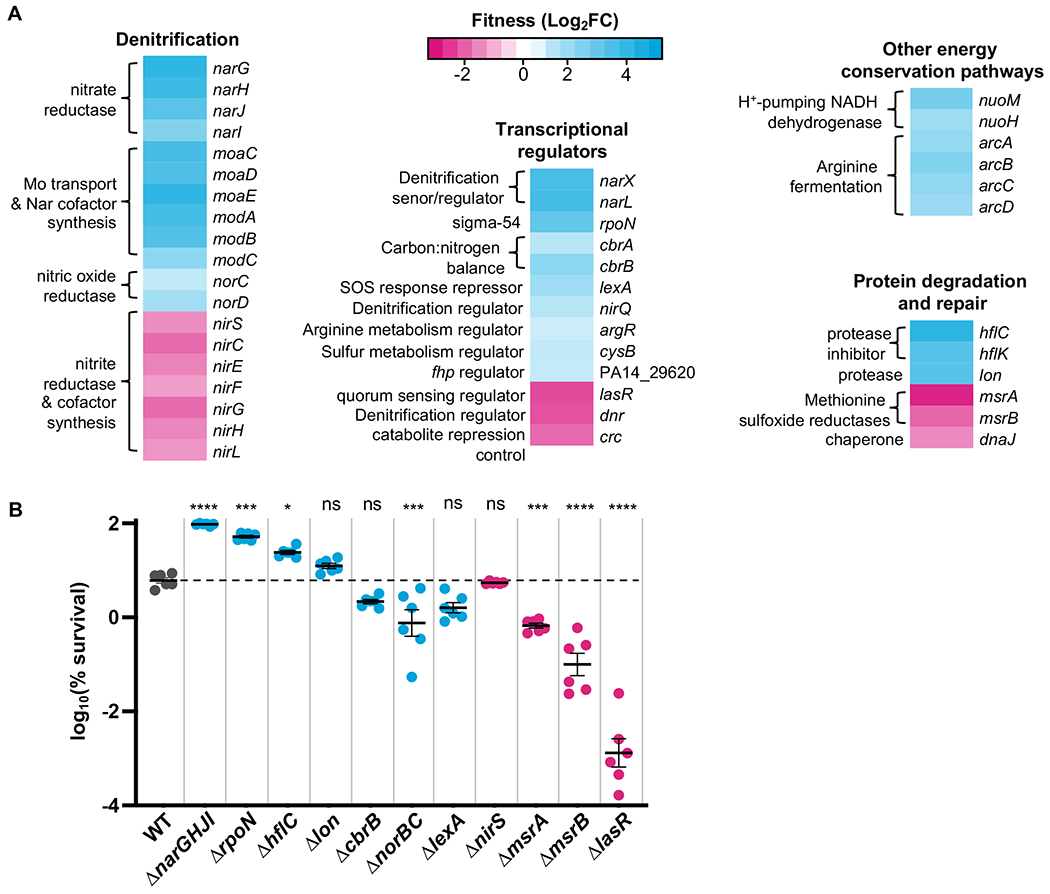
Chlorate Tn-seq results. A. Representative Tn-seq results showing genes that, when mutated, increase (cyan) or decrease (magenta) fitness during chlorate exposure (fitness is determined as log2(fold change CPM chlorate-treated vs. untreated). The complete data set can be viewed in Table S1. B. Deletion mutant strains were generated for select Tn-seq hits and exposed to chlorate to determine percent survival. Results for WT are colored in gray, and the dashed horizontal line indicates the mean percent survival for WT. Mutants predicted by the Tn-seq screen to increase or decrease in percent survival relative to WT are colored cyan and magenta, respectively. Shown are six biological replicates (three replicates per two independent experiments) with the mean ± standard error of the mean (SEM). The difference between WT and mutant log10(% survival) was determined by one-way ANOVA; ns = not significant, * = p < 0.05, ** = p < 0.01, *** = p < 0.001, **** = p < 0.0001.