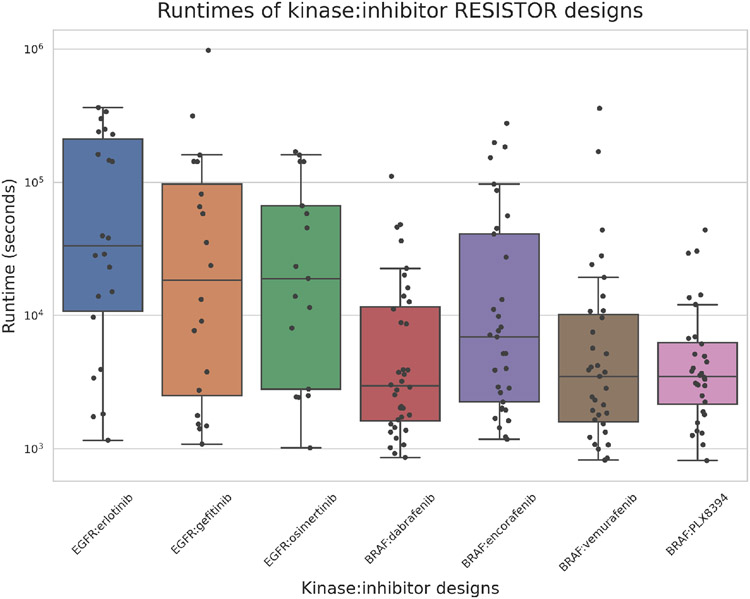
Figure 5. Positive and negative design runtimes.
Box-and-whisker plot showing the minimum, maximum, median, first quartile, and third quartile runtimes per inhibitor:kinase pair. The whiskers extend to points that lie within 1.5x the interquartile range. Each dot represents the number of seconds that Resistor took to compute the positive and negative K* designs for a given mutation location in a kinase:inhibitor complex. In other words, each dot represents the computation of 40 K* scores. The computation times across all the inhibitors range from 813 seconds to 972465 seconds, with the average being 40630 seconds or 1015 seconds per sequence. The designs were run on a 24-core, 48-thread Intel Xeon processor with 4 Nvidia Titan V GPUs.

