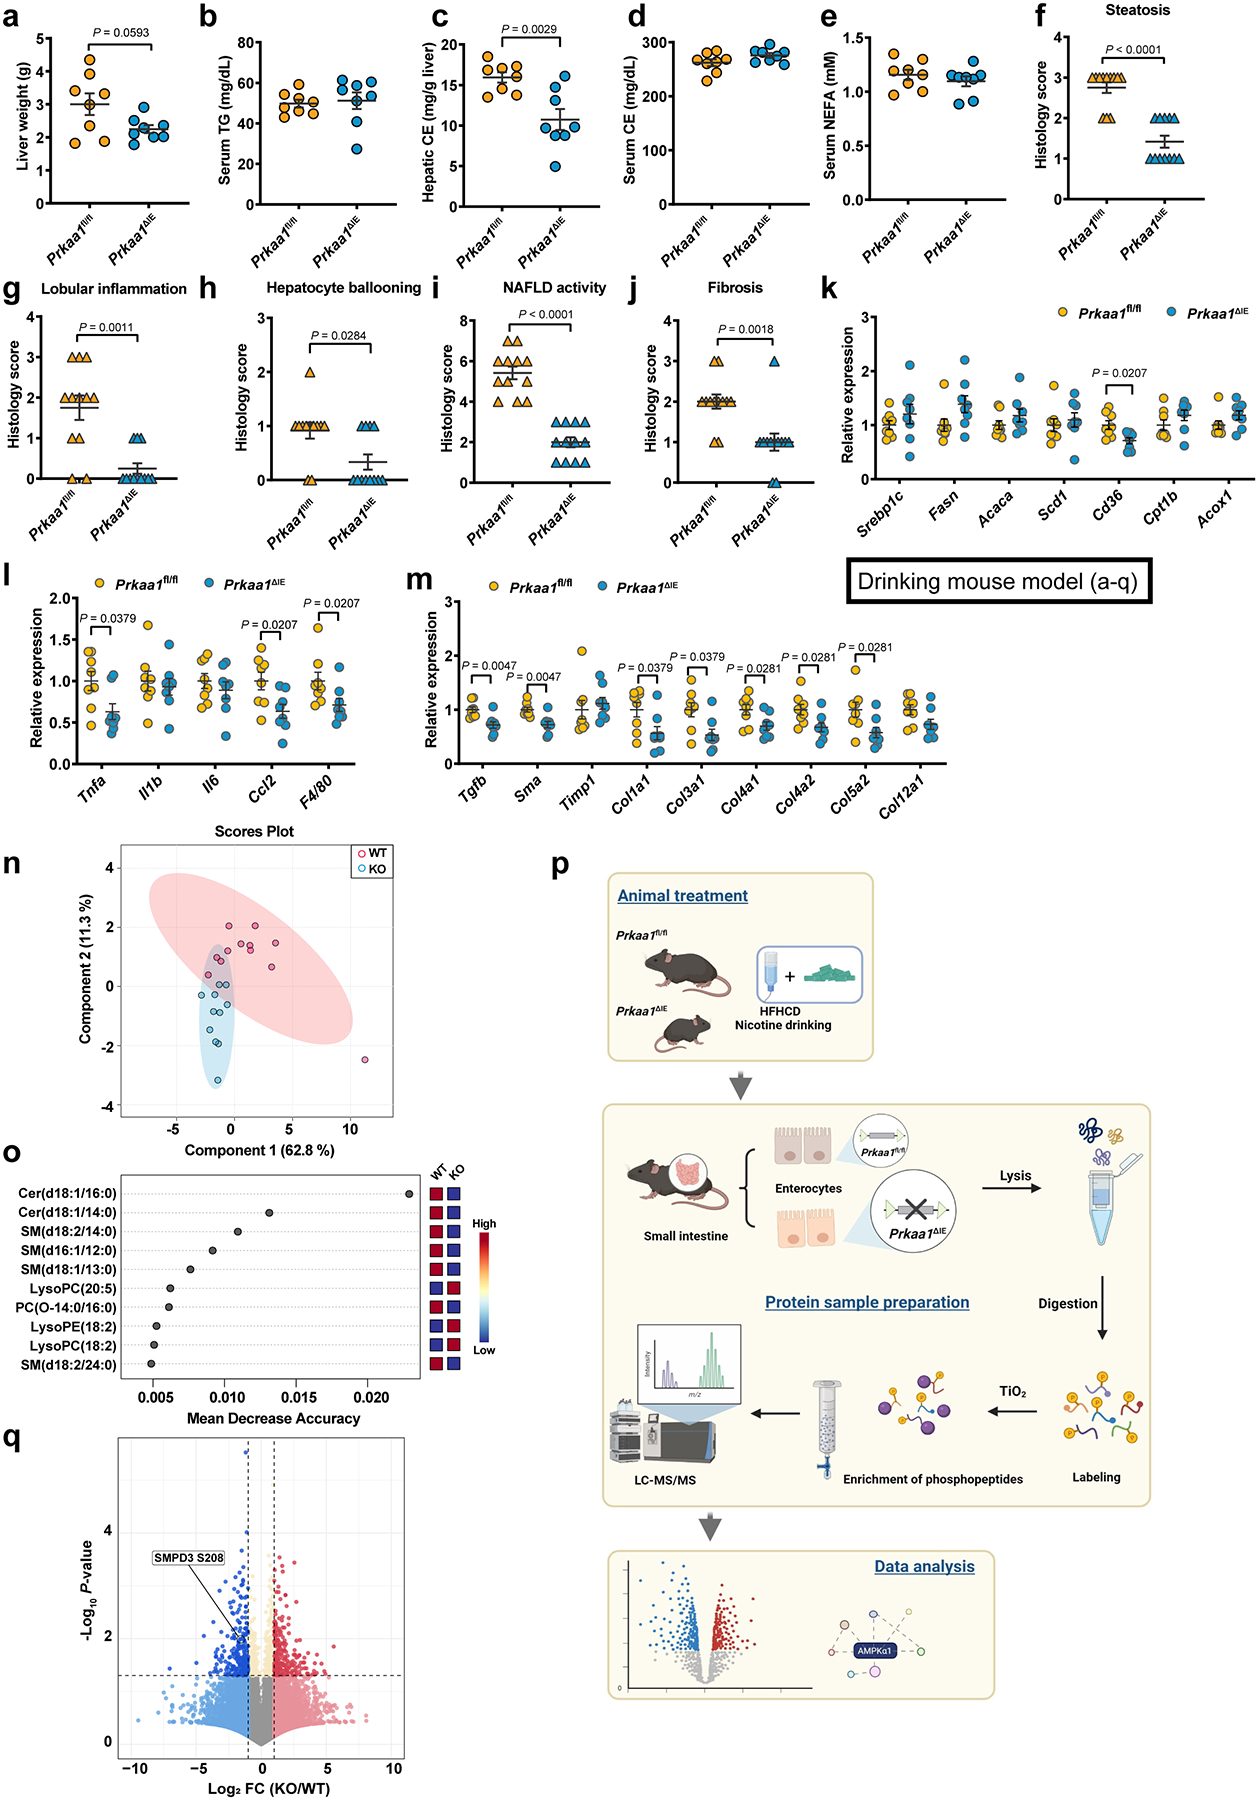
Extended Data Fig. 5. Intestinal AMPKα1 deficiency improves NAFLD progression via downregulating ceramides generation.

Eight-week-old male Prkaa1fl/fl and Prkaa1ΔIE mice were administered an HFHCD plus nicotine water for 20 weeks (SPF, n = 8 mice/group). a, Liver weight. b-e, Serum TG (b), hepatic CE (c), serum CE (d) and serum NEFA (e) contents. f-j, Histology scores of hepatic steatosis (f), lobular inflammation (g), ballooning (h), NAFLD activity (i), and fibrosis stage (j). k-m, Relative mRNA levels of genes related to hepatic lipid metabolism (k), inflammation (l) and fibrosis (m). n, o, Eight-week-old male Prkaa1fl/fl (WT) and Prkaa1ΔIE (KO) mice were administered an HFHCD plus nicotine water for 20 weeks (SPF, Prkaa1fl/fl, n = 12 mice; Prkaa1ΔIE, n = 11 mice). PLS-DA analysis of lipid metabolites in the ileum (n). Random forest analysis showing the top 10 lipid metabolites that lead to differences in the ileal lipid profiles (o). p, A schematic diagram illustrating the workflow of phosphorylated proteomics. Created with BioRender. q, Volcano map of phosphorylated proteomics analysis from ileal epithelia of Prkaa1fl/fl (WT) and Prkaa1ΔIE (KO) mice (n = 5 mice/group) administrated an HFHCD plus nicotine water for 20 weeks, relative fold change (log2) of phosphorylated sites abundance versus −log10 (P values), analysis from P values calculated by two-tailed t-test. Data are the means ± s.e.m. a-e, Two-tailed Student’s t-test. f-m, Two-tailed Mann- Whitney U-test.
