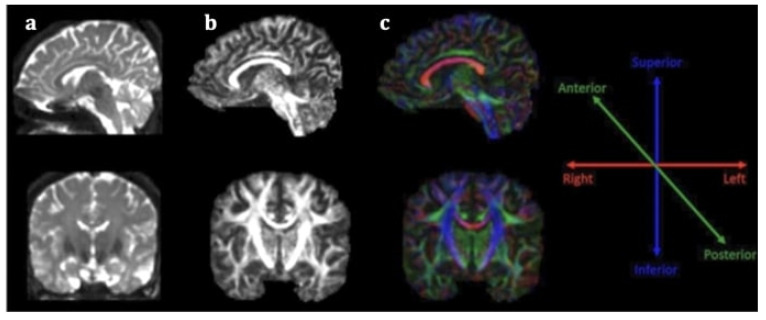
Figure 1.
Sagittal (first line) and coronal (second line) section of DTI data (a), fractional anisotropy map (b) and color fractional anisotropy map (c). The color-coding of the white matter tracts in the color fractional anisotropy map follows the assumption: red for left–right-oriented fibers, blue for superior–inferior-oriented fibers and green for anteroposterior-oriented fibers.

