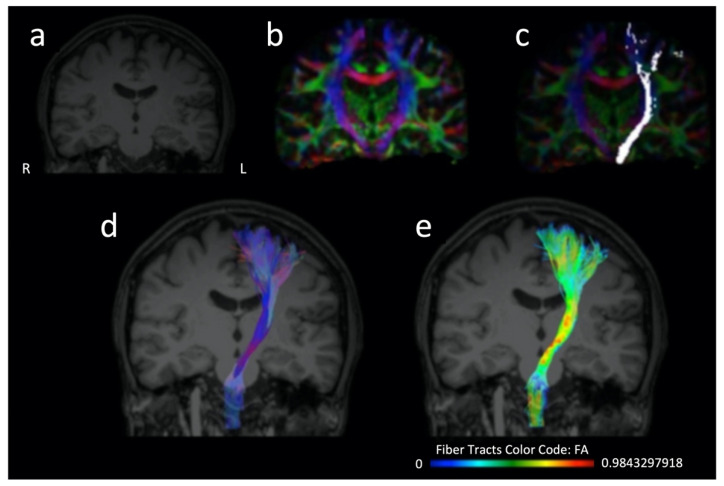
Figure 2.
Three-dimensional T1 sequence (a), color fractional anisotropy map (b), distribution of the corticospinal tract fibers projected over a color fractional anisotropy map (c), three dimensional representation of the corticospinal tract (d,e) which is further color-coded according to the distribution of the fractional anisotropy values along the tract (e) and projected over a T1 sequence (d,e). The reconstruction of the corticospinal tract has been performed on a healthy subject (who provided written informed consent for the data acquisition, analysis and presentation) using the Brainance MD platform (Advantis Medical Imaging).

