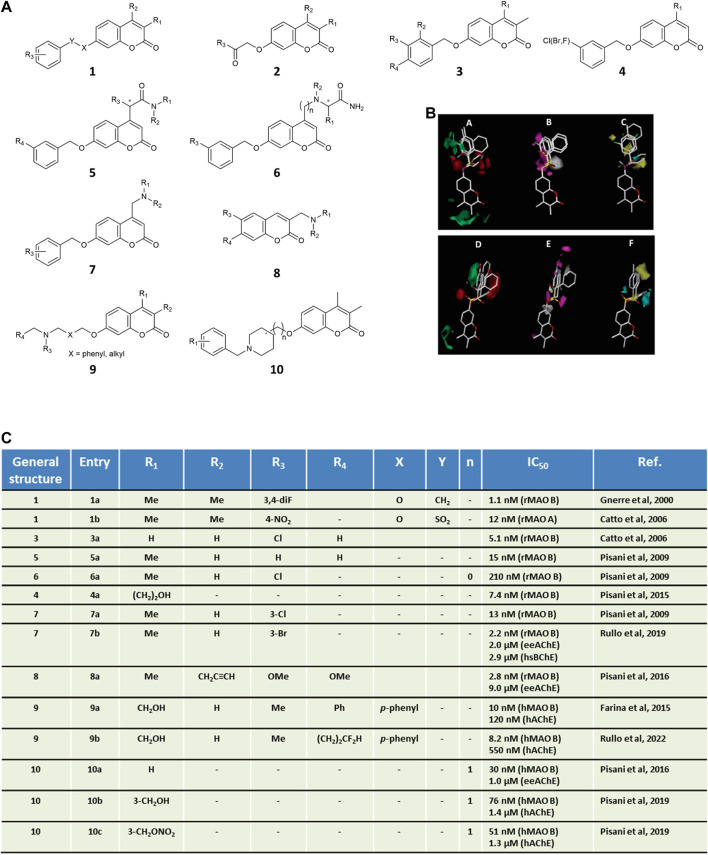
FIGURE 1.
Panel (A) general structures of coumarin-based MAO inhibitors and MTDLs. Panel (B) CoMFA isocontour maps for MAO B (A–C) and MAO A (D–F) affinity of coumarin derivatives of general structure 1. In steric maps A and D, green and red regions show allowed and forbidden regions, respectively. Electronic density areas (B,E) are depicted as favorable (magenta) and unfavorable (grey), respectively. Lipophilic interactions (C,F) are reported as favorable (yellow) and unfavorable (cyan), respectively. CoMFA images were adapted with permission from Ref. (Catto et al., 2006). Copyright 2006, American Chemical Society. Panel (C) in vitro inhibitory data for the selected coumarins.

