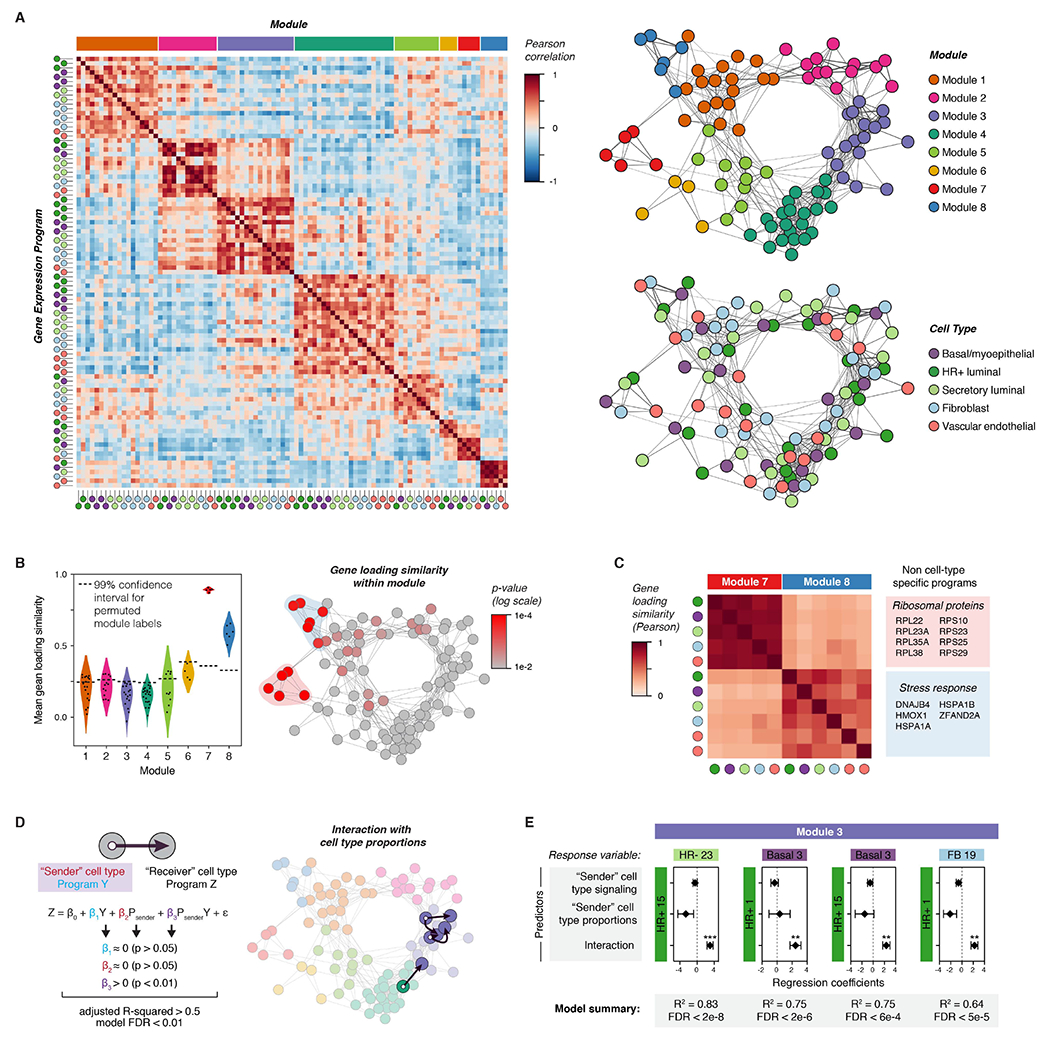
Figure 2. Inferring non-cell-type-specific transcriptional responses and direct cell-to-cell signaling interactions in the human breast.

(A) Left: Heatmap depicting Pearson correlation coefficients between activity programs in the eight major modules identified by DECIPHER-seq. Right: Network graph of correlated activity programs in the human breast. Nodes represent distinct activity programs in the indicated cell types, and edges connect significantly correlated programs (Pearson correlation coefficient > 0, p < 0.05). Modules of correlated programs were identified using a Constant Potts Model for community detection.
(B) Left: Violin plot of the mean Pearson correlation between gene loadings for each activity program and all other activity programs in the same module (“gene loading similarity”). The horizontal dashed line represents the 99% confidence interval for permuted module labels. Right: Network graph of activity programs in the human breast, colored by the p-value for gene loading similarity for each program (log scale). P-values were calculated by permutation testing.
(C) Heatmap depicting Pearson correlation coefficients between gene loadings for the indicated activity programs. The colored boxes list the top-loading genes shared by all programs in the indicated modules.
(D) Network graph of activity programs in the human breast, with arrows highlighting inferred direct cell-cell interactions. We modeled each pairwise combination of activity programs as a linear response to the mean expression score of an activity program in a “sender” cell type (β1Y), the proportion of the “sender” cell type in the epithelium (β2 Psender), and an interaction term representing the combined effect of both terms (β3 PsenderY). Arrows highlight pairs where only the interaction term is significant, the model describes over 50% of the variation in the response variable, and the FDR-corrected p-value for the overall model is less than 0.01.
(E) Results from multiple linear regression analysis, depicting the four most significant (FDR < 0.01) inferred direct cell-cell interactions. For each pairwise combination, the response variable was modeled in response to three predictors: the expression score in a “sender” cell type (signaling), the proportion of the “sender” cell type, and an interaction term between both predictors. Points represent the regression coefficient for each predictor, error bars depict the standard error.
