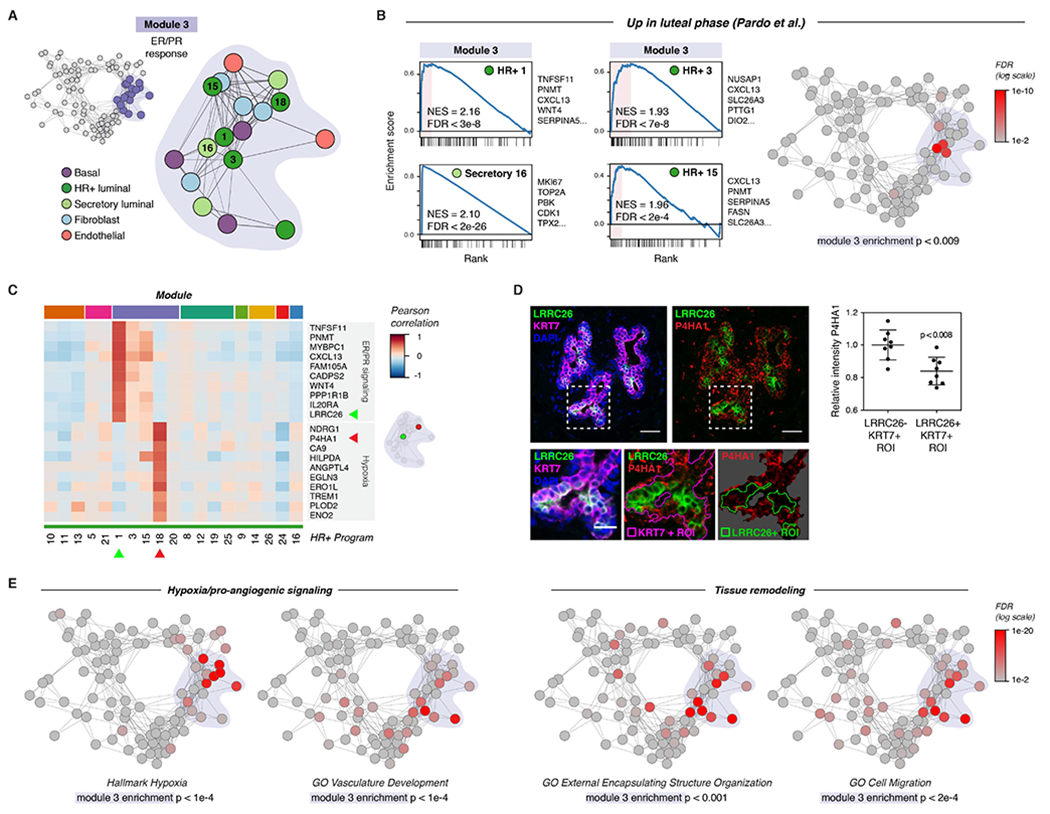
Figure 3. ER/PR signaling and the downstream response.

(A) Diagram highlighting activity programs in the “ER/PR response” module.
(B) Left: Gene set enrichment analysis of the indicated activity programs in the “ER/PR response” module, showing enrichment of genes upregulated during the luteal phase of the menstrual cycle (Pardo et al., 2014). The top five leading edge genes for each activity program are listed. Right: Network graph of activity programs, colored by the FDR for gene set enrichment of genes upregulated during the luteal phase of the menstrual cycle (log scale; Pardo et al., 2014). Overall enrichment of this gene set in the “ER/PR response” module was determined by permutation analysis.
(C) Heatmap of the top 10 marker genes for HR+ 1 and HR+ 8. Results depict the Pearson correlation between the expression score of the indicated activity programs and the normalized expression of the indicated genes across cells.
(D) Representative immunostaining for LRRC26, P4HA1, and KRT7 and quantification of the relative mean intensity of P4HA1 signal in LRRC26-/KRT7+ and LRRC26+/KRT7+ regions of interest. Data are represented as individual points, error bars indicate mean ± SEM of 8 regions from 3 samples with high ER/PR signaling. Scale bars 20 μm. Inset scale bar 10 μm.
(E) Network graph of activity programs, colored by the FDR for enrichment of the indicated gene sets in each activity program (log scale). Overall enrichment of gene sets within module 1 was determined by permutation analysis.
