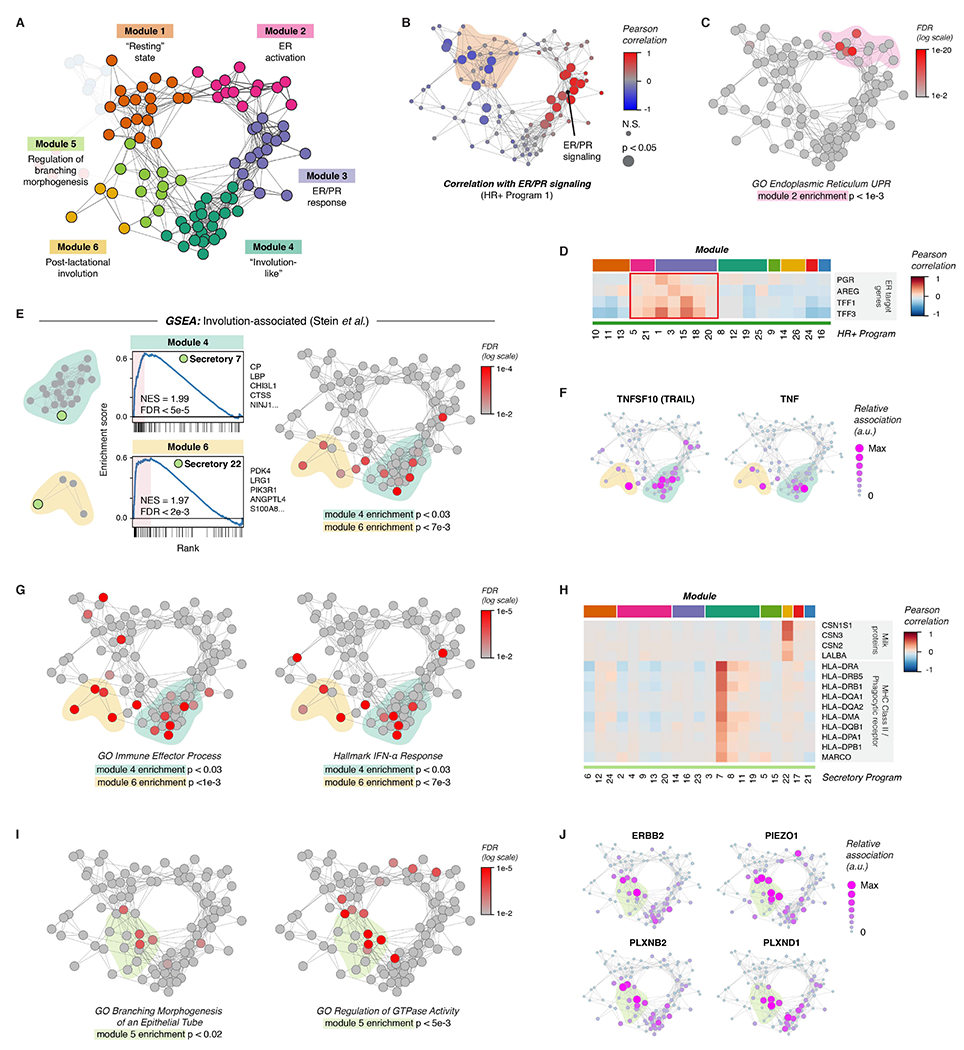
Figure 4. Coordinated changes in signaling states across cell types in the breast.

(A) Network diagram highlighting Modules 1-6.
(B) Network graph of activity programs in the human breast, colored by the Pearson correlation of each program’s mean expression score across samples with ER/PR signaling (HR+ activity program 1). Significant positive and negative correlations as identified by bootstrap resampling are represented by larger nodes.
(C) Network graph of activity programs, colored by the FDR for enrichment of genes in the GO Biological Process set “Endoplasmic Reticulum Unfolded Protein Response” (log scale). Overall enrichment of this gene set within module 2 was determined by permutation analysis.
(D) Heatmap of selected estrogen receptor (ER) target genes. Results depict the Pearson correlation between the expression score of the indicated activity programs and the normalized expression of ER target genes across cells.
(E) Left: Gene set enrichment analysis of the indicated activity programs in the “Involution-associated” and “Post-lactational involution” modules, showing enrichment of genes previously shown to be upregulated during the post-lactational involution in the mouse (Stein et al., 2004). The top five leading edge genes for each activity program are listed. Right: Network graph of activity programs, colored by the FDR for enrichment of genes upregulated in the Stein gene set (log scale). Overall enrichment of this gene set in each of the indicated modules was determined by permutation analysis.
(F) Network graph of activity programs, depicting the relative association of the indicated marker genes with each activity program (arbitrary units, linear scale).
(G) Network graph of activity programs, colored by the FDR for enrichment of the indicated gene sets in each activity program (log scale). Overall enrichment of gene sets within the indicated modules was determined by permutation analysis.
(H) Heatmap of selected genes including milk proteins, MHC Class II molecules, and the phagocytic receptor MARCO. Results depict the Pearson correlation between the expression score of the indicated activity programs and the normalized expression of the indicated genes across cells.
(I) Network graph of activity programs, colored by the FDR for enrichment of the indicated gene sets in each activity program (log scale). Overall enrichment of gene sets within module 5 was determined by permutation analysis.
(J) Network graph of activity programs, depicting the relative association of the indicated marker genes with each activity program (arbitrary units, linear scale).
