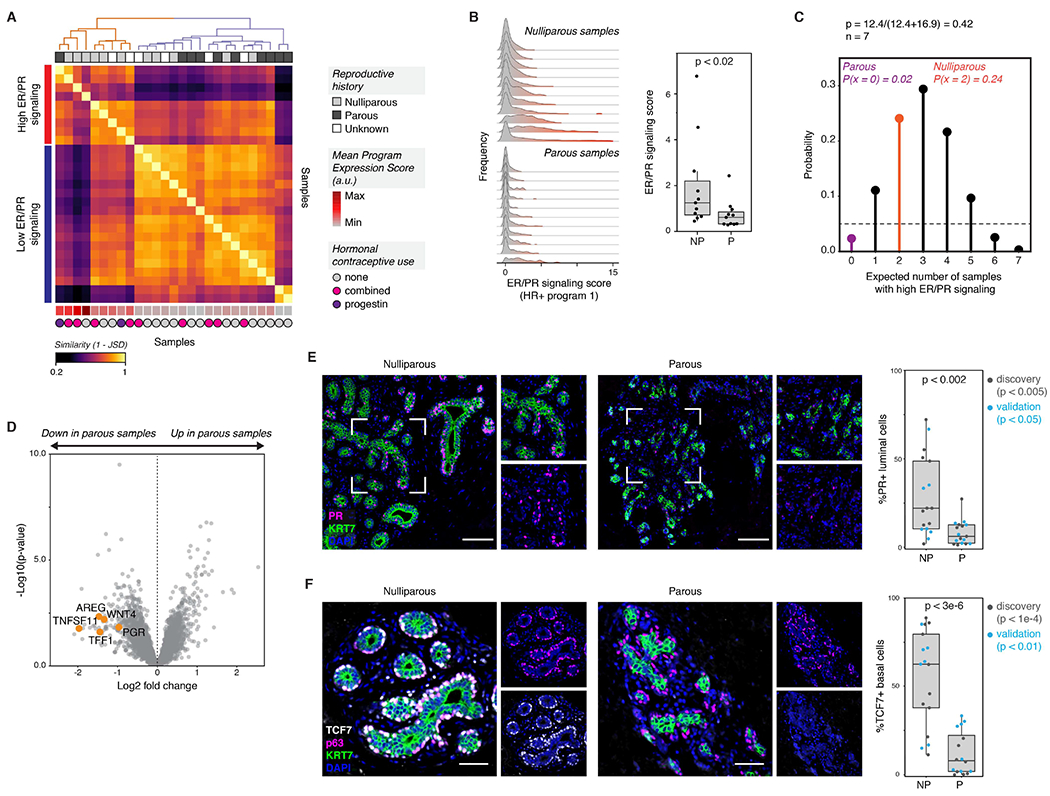
Figure 5. The ER/PR signaling response of HR+ luminal cells is reduced in parous women.

(A) Heatmap showing the similarity between each sample’s single-cell expression score distribution across HR+ activity program 1 (ER/PR signaling), measured as (1 - Jensen-Shannon distance). Hierarchical clustering (complete linkage) identifies two sets of samples representing high or low expression of the “ER/PR signaling” gene program. The mean expression score for HR+ activity program 1 is annotated at the bottom of the heatmap (arbitrary units, linear scale).
(B) Ridge plots depicting the distribution of HR+ program 1 (ER/PR signaling) expression in HR+ luminal cells across nulliparous (NP) versus parous (P) samples, and quantification of the average expression score for HR+ program 1 (n = 22 samples, p < 0.02, Mann-Whitney test). Data are represented as individual points; box indicates the median and interquartile range (IQR) for 11 nulliparous and 11 parous samples; whiskers extend from Q1 - 1.5IQR to Q3 + 1.5IQR.
(C) Binomial probability distribution for the expected number of samples with high ER/PR signaling. The binomial probability of high ER/PR signaling is modeled as the average length of the luteal phase of the menstrual cycle, in days, divided by the average total length of the menstrual cycle (p = 0.42) (Bull et al., 2019).
(D) Volcano plot highlighting the differential expression of canonical hormone-responsive genes between parous and nulliparous “pseudo-bulk” samples in HR+ luminal cells. Dots represent individual genes.
(E) Immunostaining for PR and KRT7, and quantification of the percentage of PR+ cells within the KRT7+ luminal compartment for nulliparous (NP) versus parous (P) samples (n = 34 samples, p < 0.002, Mann-Whitney test). Results are shown for a subset of the original cohort of sequenced samples (“discovery set”, n=19 samples, p < 0.005) and a second independent cohort of samples (“validation” set, n = 15 samples, p < 0.05). Scale bars 100 μm. Data are represented as individual points; box indicates the median and interquartile range (IQR) for the combined dataset (N = 17 nulliparous samples and 17 parous samples); whiskers extend from Q1 - 1.5IQR to Q3 + 1.5IQR.
(F) Immunostaining for TCF7, p63, and KRT7, and quantification of the percentage of TCF7+ cells within the p63+ basal/myoepithelial cell compartment for nulliparous (NP) versus parous (P) samples (n = 33 samples, p < 3e-6, Mann-Whitney test). Results are shown for a subset of the original cohort of sequenced samples (“discovery set”, n=18 samples, p < 1e-4) and a second independent cohort of samples (“validation” set, n = 15 samples, p < 0.01). Scale bars 50 μm. Data are represented as individual points; box indicates the median and interquartile range (IQR) for the combined dataset (N = 17 nulliparous samples and 16 parous samples); whiskers extend from Q1 − 1.5IQR to Q3 + 1.5IQR.
