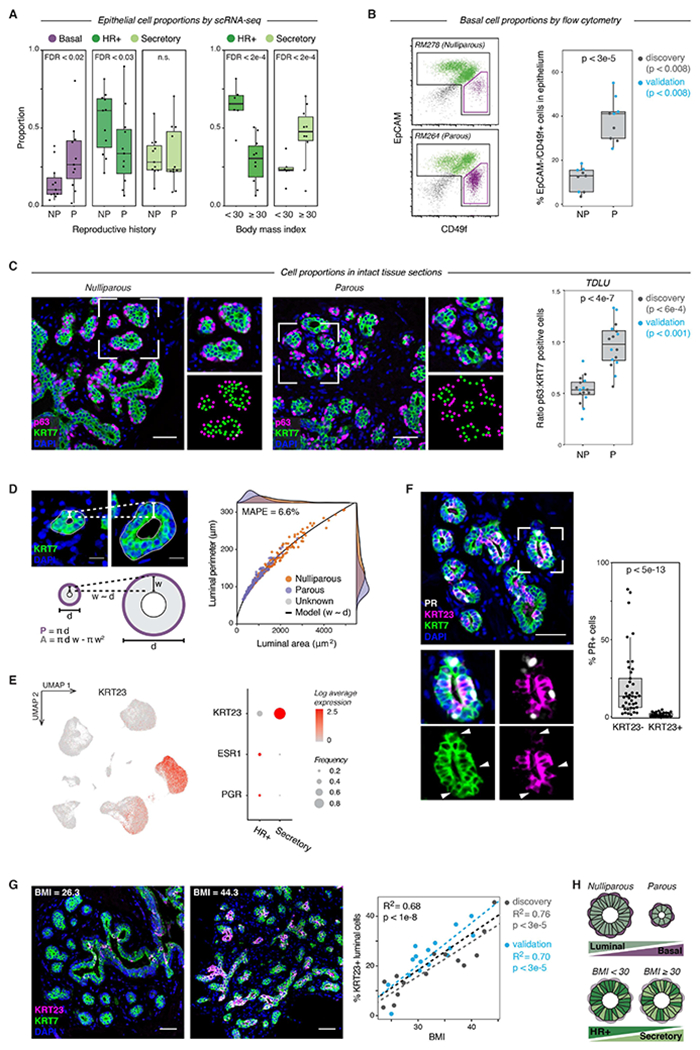
Figure 6. Reproductive history and body mass index are associated with epithelial cell proportions.

(A) Quantification of the proportion of the indicated cell types by scRNA-seq for nulliparous versus parous samples (n = 22 samples, Wald test) and obese versus non-obese samples (n = 16 samples, Wald test). Data are represented as individual points; box indicates the median and interquartile range (IQR) (Left: N = 11 nulliparous and 11 parous samples. Right: N = 6 samples with BMI < 30 and 10 samples with BMI ≥ 30); whiskers extend from Q1 − 1.5IQR to Q3 + 1.5IQR.
(B) Representative flow cytometry analysis of the percentage of EpCAM−/CD49f+ basal cells within the Lin- epithelial population, and quantification of the percentage of basal cells in nulliparous (NP) versus parous (P) women (n = 18 samples; p < 3e-5, Mann-Whitney test). Results are shown for a subset of the original cohort of sequenced samples (“discovery set”, n=9 samples, p < 0.008) and a second independent cohort of samples (“validation” set, n = 9 samples, p < 0.008). Data are represented as individual points; box indicates the median and interquartile range (IQR) for the combined dataset (N = 9 nulliparous and 9 parous samples); whiskers extend from Q1 − 1.5IQR to Q3 + 1.5IQR.
(C) Immunostaining for the basal/myoepithelial marker p63 and pan-luminal marker KRT7 in terminal ductal lobular units (TDLUs), and quantification of the ratio of p63+ basal cells to KRT7+ luminal cells in nulliparous (NP) versus parous (P) women (n = 32 samples; p < 4e-7, Mann-Whitney test). Results are shown for a subset of the original cohort of sequenced samples (“discovery set”, n=17 samples, p < 6e-4) and a second independent cohort of samples (“validation” set, n = 15 samples, p < 0.001). Data are represented as individual points; box indicates the median and interquartile range (IQR) for the combined dataset (N = 16 nulliparous and 16 parous samples); whiskers extend from Q1 − 1.5IQR to Q3 + 1.5IQR. Scale bars 50 μm.
(D) Two-dimensional geometric model of the relative space available for basal cells (luminal perimeter, P) and luminal cells (luminal area, A) within individual acini. Acini were modeled as hollow circles with a shell thickness (w) proportional to their diameter (d). Dots represent measurements of individual acini from TDLUs in parous (n=158 acini from 15 samples) or nulliparous (n=164 acini from 16 samples) specimens as indicated. Line represents results from geometric model (mean absolute percentage error = 6.6%). Scale bars 15 μm.
(E) Left: UMAP depicting log normalized expression of KRT23 in reduction mammoplasty samples (GSE198732). Right: Dot plot depicting the log normalized mean and frequency of KRT23, ESR1, and PGR expression across luminal cell types.
(F) Co-immunostaining of PR, KRT23, and the pan-luminal marker KRT7, and quantification of the percentage of PR+ cells within the KRT23− and KRT23+ luminal cell populations (n = 41 samples; p < 5e-13, Mann-Whitney test). Data are represented as individual points; box indicates the median and interquartile range (IQR) for 41 samples; whiskers extend from Q1 − 1.5IQR to Q3 + 1.5IQR. Scale bar 50 μm.
(G) Co-immunostaining of KRT23 and KRT7 and linear regression analysis of the percentage of KRT23+ luminal cells versus BMI (n = 30 samples; R2 =0.68, p < 1e-8, Wald test). Scale bars 50 μm. Results are shown for a subset of the original cohort of sequenced samples (“discovery set”, n=14 samples; R2 =0.76, p < 3e-5) and a second independent cohort of samples (“validation” set, n = 16 samples; R2 =0.70, p < 3e-5). Data are represented as individual points; dotted lines represent the best-fit lines for the discovery cohort (light grey), validation cohort (blue), and combined cohort (dark grey).
(H) Summary of changes in epithelial cell proportions with prior pregnancy and obesity (BMI ≥ 30).
