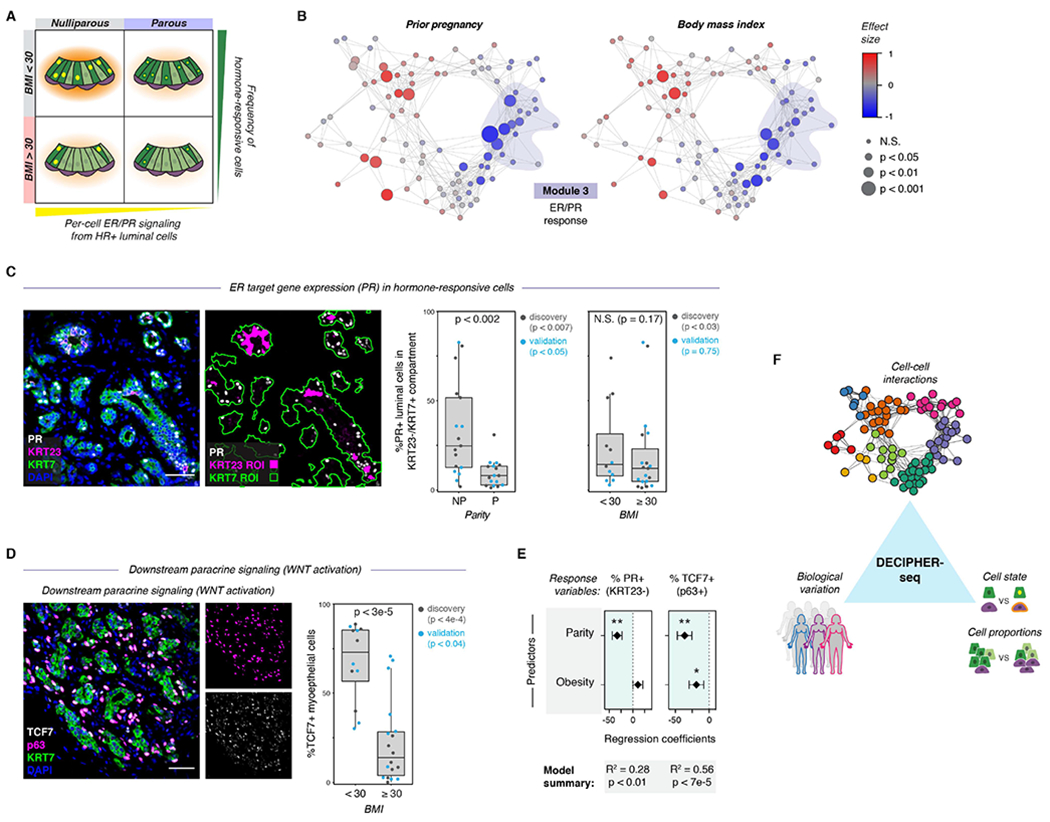
Figure 7. Biological variables are linked to predicted tissue states.

(A) Schematic depicting the model for how parity and obesity impact hormone signaling in the breast through distinct mechanisms. Parity affects per-cell ER/PR signaling in HR+ luminal cells, and obesity (BMI ≥ 30) leads to a reduction in the proportion of hormone-responsive (HR+) luminal cells in the epithelium.
(B) Network graph of activity programs in the human breast, colored by the effect size of prior pregnancy (Wilcoxon effect size) or body mass index (Pearson correlation coefficient) on each activity program (linear scale). Significant positive and negative associations are represented by larger nodes (prior pregnancy: Mann-Whitney test; BMI: Wald test).
(C) Co-immunostaining of the estrogen receptor target gene PR, KRT23, and the pan-luminal marker KRT7, and quantification of the percentage of PR+ cells in the KRT23−/KRT7+ luminal cell population for nulliparous (NP) versus parous (P) samples (n = 34 samples, p < 0.002, Mann-Whitney test) or non-obese (BMI <30) versus obese (BMI ≥ 30) samples (n = 31 samples, p = 0.17, Mann-Whitney test). Results are shown for a subset of the original cohort of sequenced samples (“discovery” set) and a second independent cohort of samples (“validation” set). Data are represented as individual points; boxes indicate the median and interquartile range (IQR) for the combined datasets (Left: N = 17 nulliparous and 17 parous samples. Right: N = 12 samples with BMI < 30 and 19 samples with BMI ≥ 30); whiskers extend from Q1 − 1.5IQR to Q3 + 1.5IQR. Scale bar 50 μm.
(D) Immunostaining forTCF7, p63, and KRT7, and quantification of the percentage of TCF7+ cells within the p63+ basal/myoepithelial cell compartment for non-obese (BMI <30) versus obese (BMI ≥ 30) samples (n = 30 samples, p < 3e-5, Mann-Whitney test). Results are shown for a subset of the original cohort of sequenced samples (“discovery set”, n=14 samples, p < 4e-4) and a second independent cohort of samples (“validation” set, n = 16 samples, p < 0.04). Data are represented as individual points; box indicates the median and interquartile range (IQR) for the combined dataset (N = 12 samples with BMI < 30 and 18 samples with BMI ≥ 30); whiskers extend from Q1 − 1.5IQR to Q3 + 1.5IQR. Scale bar 50 μm.
(E) Results from multiple linear regression analysis, with prior pregnancy (parity) and obesity (BMI ≥ 30) as predictors and the percentage of PR+ cells in the KRT23−/KRT7+ luminal cell population or of TCF7+ cells in the p63+ basal cell compartment as response variables. Points represent the regression coefficient for each predictor, error bars depict the standard error.
(F) Summary of results. DECIPHER-seq predicts how specific changes in transcriptional cell state and cell type proportions influence cell-cell interactions in the human breast, and links specific sources of biological variation (e.g. Parity, BMI) to the overall signaling state of the tissue.
