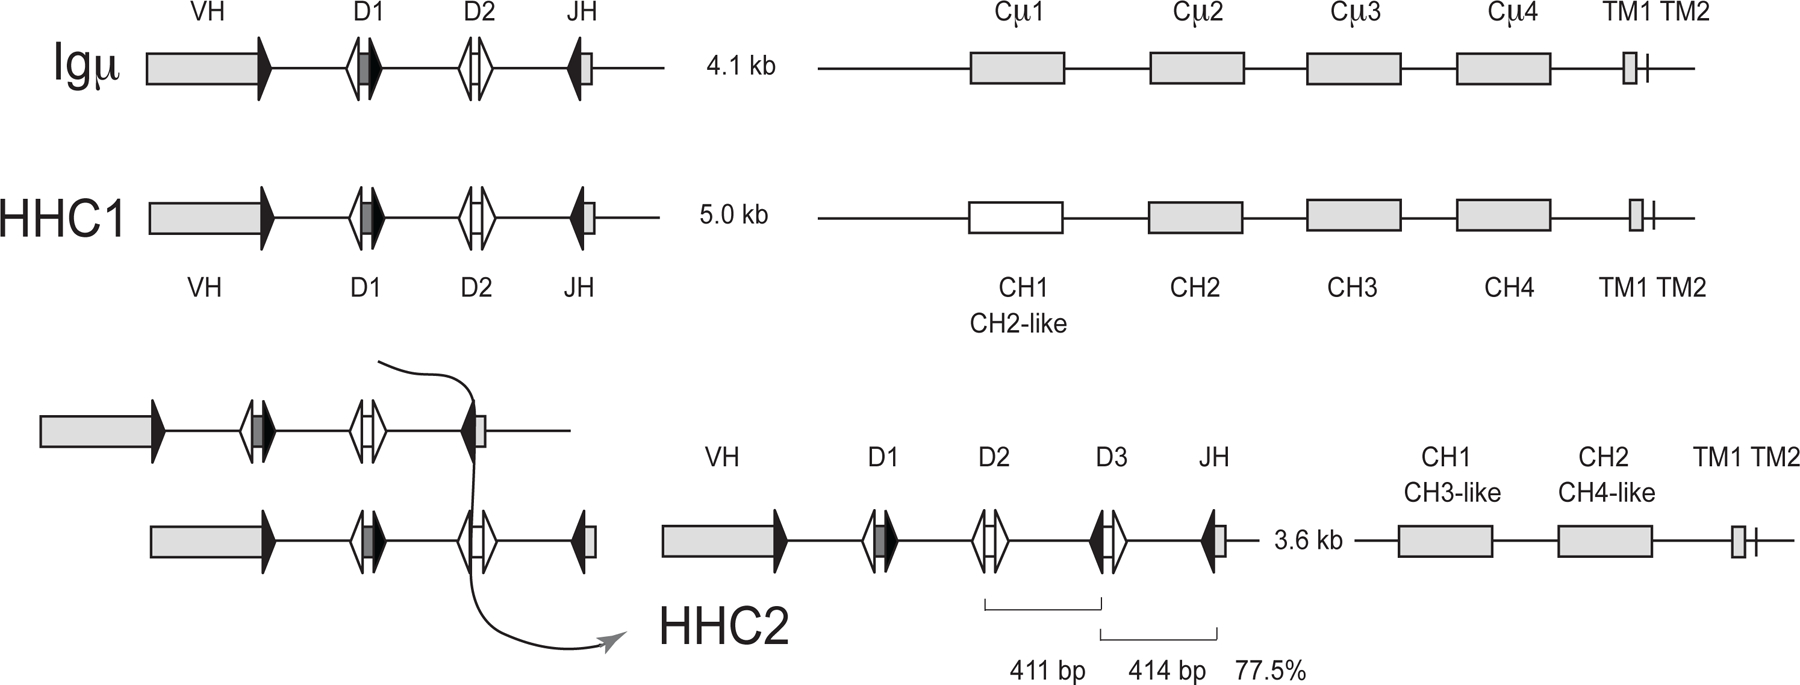
Figure 2.

Organization of Igμ, HHC1, and HHC2 clusters in the efish germline. Top. The Igμ cluster was derived from the overlap of KI636074.1 (signal sequence, VH gene segments, Cμ1, Cμ2) with AAVX02048050.1 (J-C intron, Cμ1–4 to TM2), and AAVX02033970.1 (Cμ2 to TM2). Middle. HHC1 was derived from AAVX02046069.1 (signal sequence, VH gene segments, CH1–3) and AAVX02045384.1 (CH1–4 to TM2). Bottom. At right: HHC2 organization is from AAVX02033307.1. Analysis of the HHC2 showed 77.5% identity over the regions indicated in brackets, suggesting (at left) that a duplication event generated the third D gene segment and the intersegmental sequence. Signal sequences are not depicted for simplicity. Rectangles represent VH gene segments and C region exons (as labeled). The HHC1 CH1 sequence showed homology to its CH2 exon. The HHC2 CH1 and CH2 exons showed similarity to the μ and HHC1 CH3 and CH4, as indicated. Triangles represent recombination signal sequences with 23 bp spacer (filled) or 12 bp spacer (open). The J-C intron sizes are shown, but otherwise distances are not to scale.
