
Figure 3.
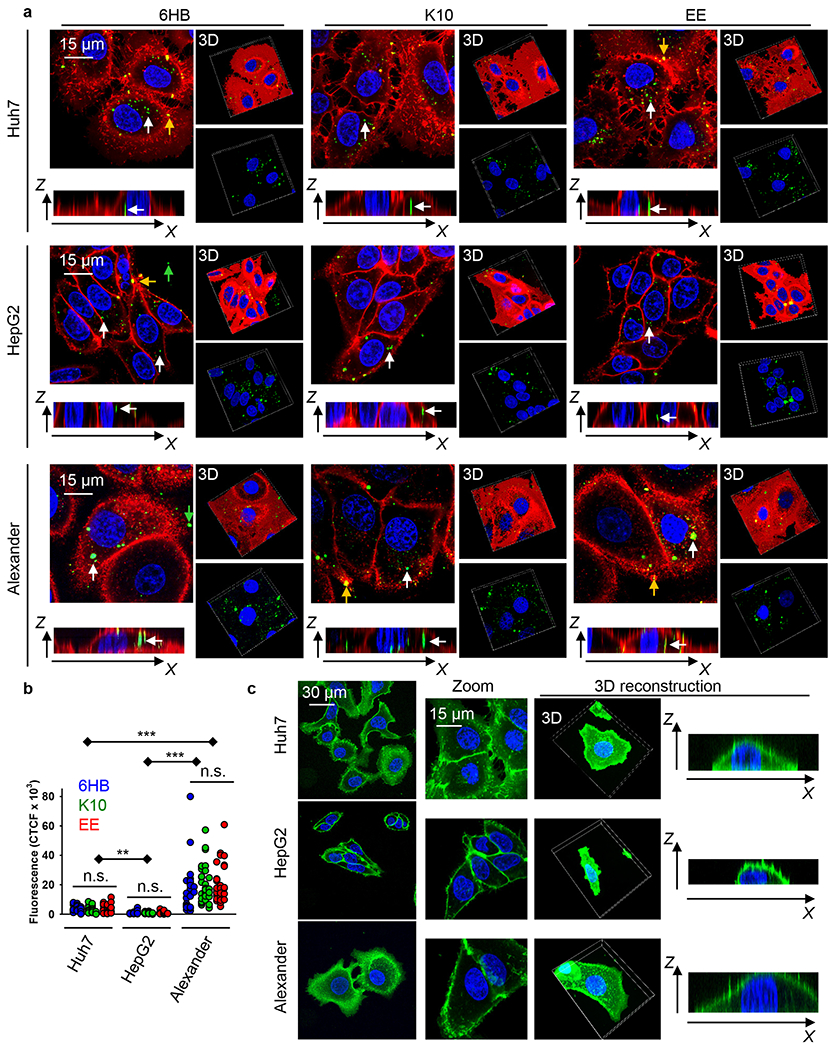
Uptake of different DNs by three distinct hepatic cell lines. (a) Alexander, HepG2, and Huh7 cell lines were treated with a 50 nM concentration of different fluorescently labeled (green fluorescence) DNs for 24 h. After treatment, cells were stained using CellMask Orange (Thermo Fisher Scientific) plasma membrane stain. Stained cells were imaged using spinning disk confocal microscopy IXplore SpinSR (Olympus, Tokyo, Japan). 3D rendering orthogonal projections were done using ImageJ software (NIH). Representative images from three independent experiments are presented. White arrows indicate internalized DNs; yellow arrows show DNs attached to the membrane surface; and green arrows depict extracellular DNs. (b) Quantification of DNs uptake. Cells were treated and imaged as in (a). The intracellular DNs were measured as corrected total cell fluorescence (CTCF) of the full area of interest using ImageJ software (NIH). Data are expressed out of at least three independent experiments (n = 30 cells). (**) P < 0.01 and (***) P < 0.001 denote significant differences. (c) Assessment of cell size and morphology in Huh7, HepG2, and Alexander cells. Cells were stained with CellMask Green (Thermo Fisher Scientific) plasma membrane stain. Nuclei were counterstained with Hoechst 33342 (Thermo Fisher Scientific). Stained cells were imaged using spinning disk confocal microscopy IXplore SpinSR (Olympus, Tokyo, Japan). Representative images out of three independent experiments are presented. 3D rendering orthogonal projections were done using ImageJ software (NIH).