
Figure 4.
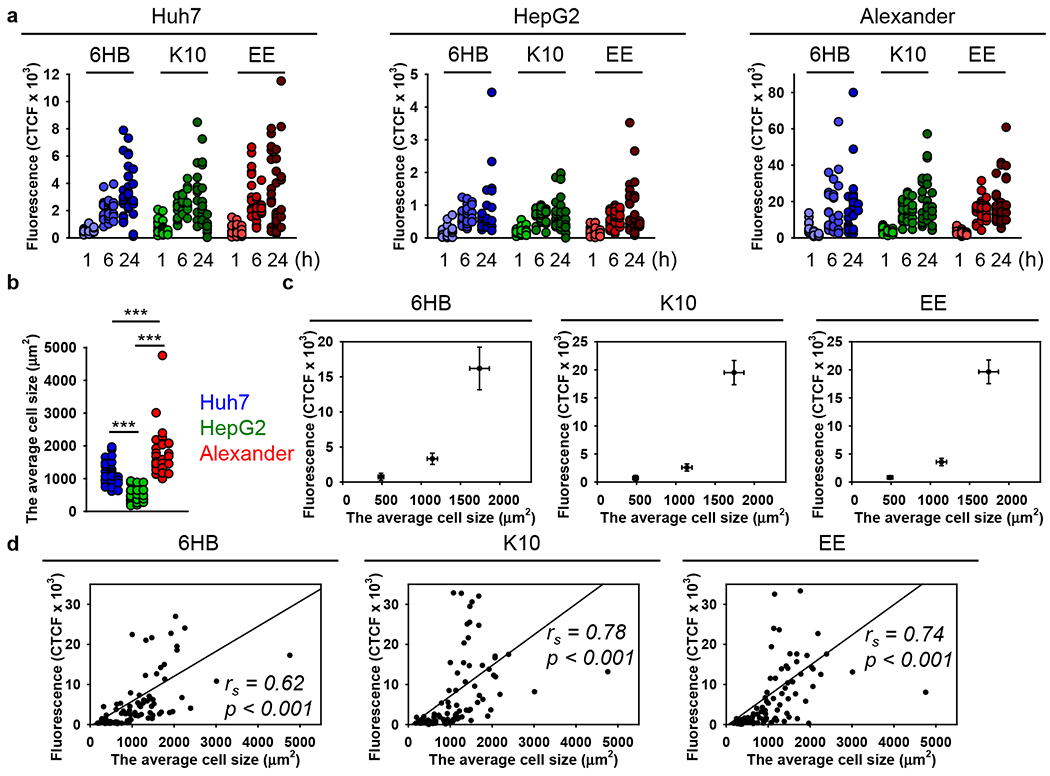
Uptake kinetics assessment of different DNs. (a) Alexander, HepG2, and Huh7 cell lines were treated with a 50 nM concentration of different DNs for 1, 6, and 24 h. After treatment, cells were fixed with 4% paraformaldehyde (VWR) and labeled with CellBrite Blue (Biotium) plasma membrane stain. Stained cells were imaged using spinning disk confocal microscopy IXplore SpinSR (Olympus, Tokyo, Japan). The intracellular DNs were measured as corrected total cell fluorescence (CTCF) of the full area of interest using ImageJ software (NIH). Data are expressed out of at least three independent experiments (n = 28–34 cells). (b) Assessment of cell size in Huh7, HepG2, and Alexander cells. Cells were stained with CellMask Green (Thermo Fisher Scientific) plasma membrane stain. Nuclei were counterstained with Hoechst 33342 (Thermo Fisher Scientific). Stained cells were imaged using spinning disk confocal microscopy IXplore SpinSR (Olympus, Tokyo, Japan). The average cell area was measured using ImageJ software (NIH) and is presented as means of n = 30 cells. (***) p < 0.001 denotes significant differences. (c) Cell-size-dependent DNs uptake. The intracellular DNs presented as CTCF after 24 h treatment with 50 nM concentration of different DNs were plotted versus corresponding cell size. (d) Linear correlation between cell size and DNs uptake. Each black point represents confocal microscopy-measured single-cell DN uptake plotted against corresponding cell size. The uptake is expressed as CTCF after 24 h treatment with 50 nM concentration of different DNs. Correlation coefficients and P values were calculated using SigmaPlot 13 software (Systat Software, Inc.).