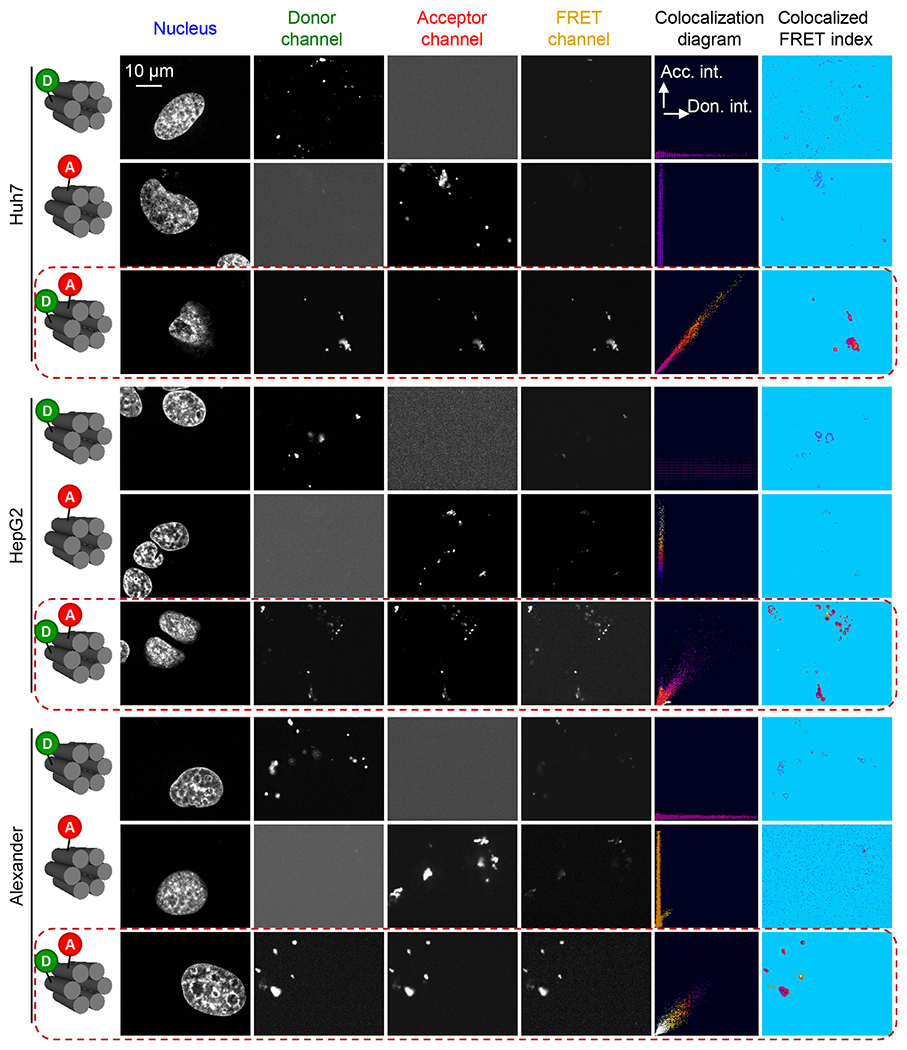
Figure 5.

FRET microscopy images of Alexander, HepG2, and Huh7 cells treated with 6HB labeled with FRET reporter dyes (6-carboxyfluorescein donor and TAMRA acceptor). Images of the three detection channels (donor, acceptor, and FRET) are shown. The calculated colocalization diagram and colocalized FRET index after the subtraction of spectral bleed-through. Alexander, HepG2, and Huh7 cells were treated with a 50 nM concentration of 6HB labeled with FRET reporter dyes for 24 h. Nuclei were counterstained with Hoechst 33342 (Thermo Fisher Scientific). Confocal images were taken and analyzed for FRET using the “FRET and colocalization analyzer” ImageJ plug-in.115 “Colocalized FRET index” images present the calculated amount of FRET for each pixel in the FRET channel. The ImageJ plug-in color codes the relative FRET efficiency ranging from blue (none FRET efficiency) to red-yellow (high FRET efficiency). The “Colocalization diagram” plots display pixel colocalization as well as color coded FRET efficiency in a 2D plot.
