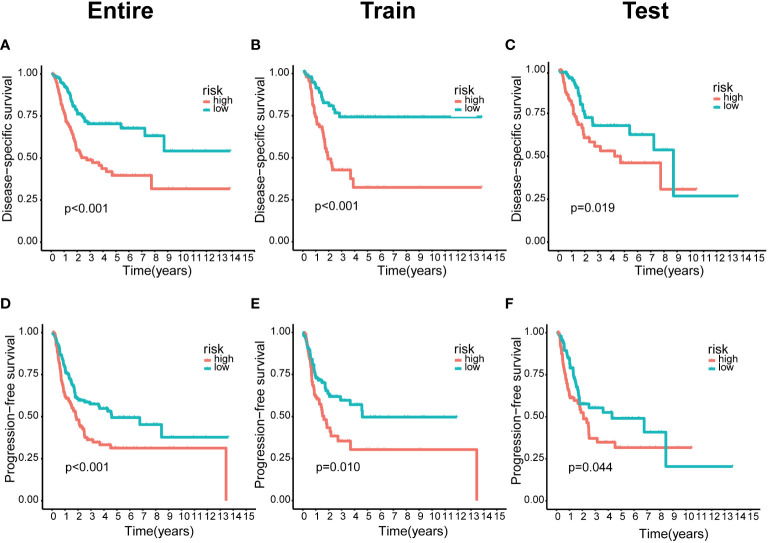
Figure 3.
The lower risk group had a better prognosis in the risk model. (A–C) Kaplan-Meier curves of disease-specific survival in the entire, train and test sets, respectively, in the high-risk group compared with the low-risk group. (D–F) Kaplan–Meier curves of progression-free survival in the entire, train and test sets, respectively, in the high-risk group compared with the low-risk group.

