Figure 6.
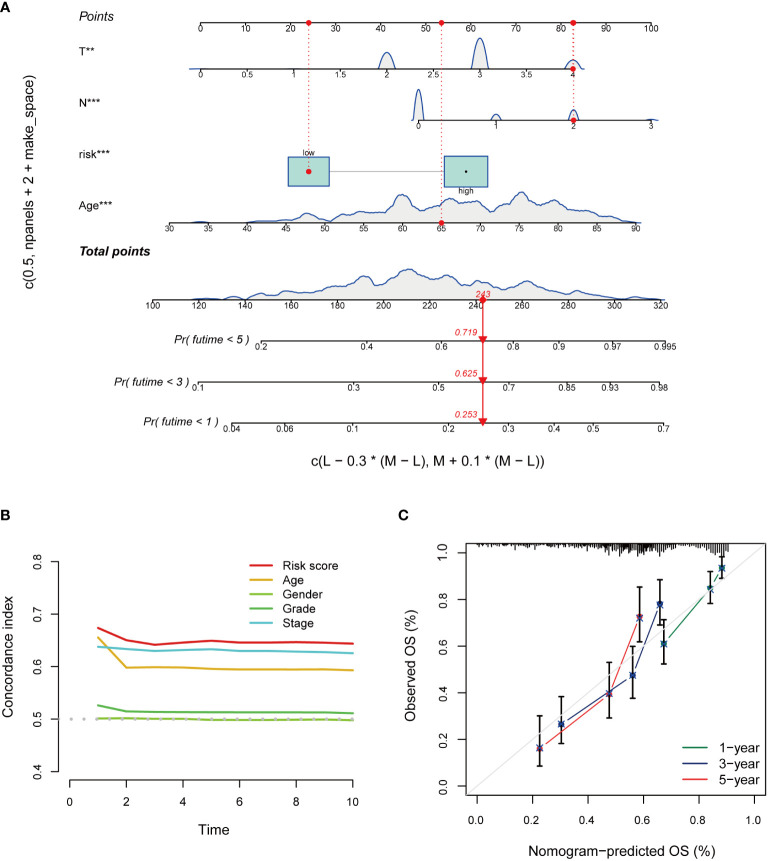
Construction and evaluation of the nomogram of the risk model. (A) Nomogram combines risk scores and clinical features to predict 1-, 3-, and 5-year overall survival. (B) Concordance index of risk score and clinical characteristics. (C) The calibration curves for 1-, 3-, and 5-year overall survival. *P < 0.05, **P < 0.01, ***P < 0.001.

