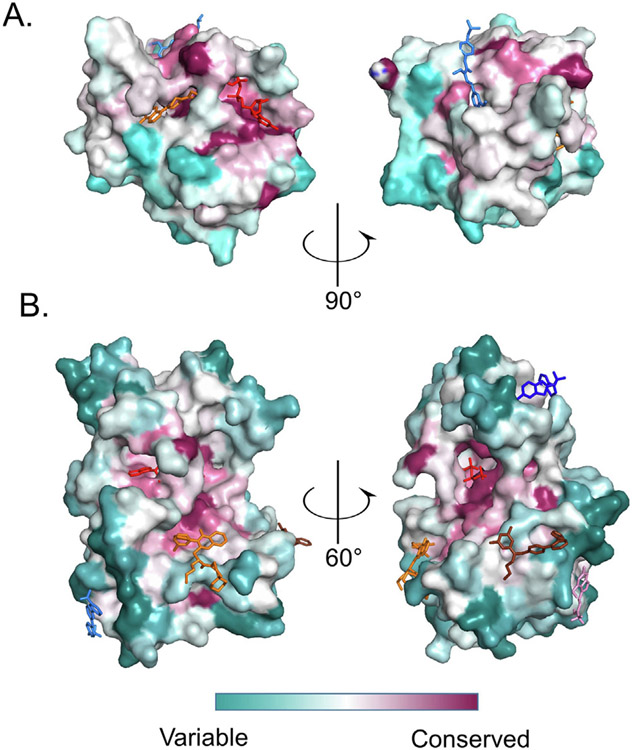
Figure 4.
Allosteric sites for RAS and kinase families are not conserved. Protein sequences for kinases or RAS families were aligned and relative conservation scores for each amino acid were calculated using the ConSurf server and plotted on the surface of a prototypical family member fold. (A) Conservation scores for the RAS family are plotted on the surface of KRAS PDB 4LDJ. Representative compounds are ARS1620 (orange from PDB 5V9U), XY-02-075 (red from PDB 5KYK) and CH-2 (blue from PDB 6GQX). (B) Conservation scores for 493 kinases are plotted on the 3D structure of Aurora A (PDB 3E5A). Representative compounds: Compound 38 in orange (from PDB 3F9N), GNF2 in cyan (from PDB 3K5V), Compound 3 in chocolate (from PDB 3O2M), RS1 in blue (from PDB 4RQK), CHEMBL1230164 in pink (from PDB 3NEW) and ATP in red (from PDB 1S9J).

