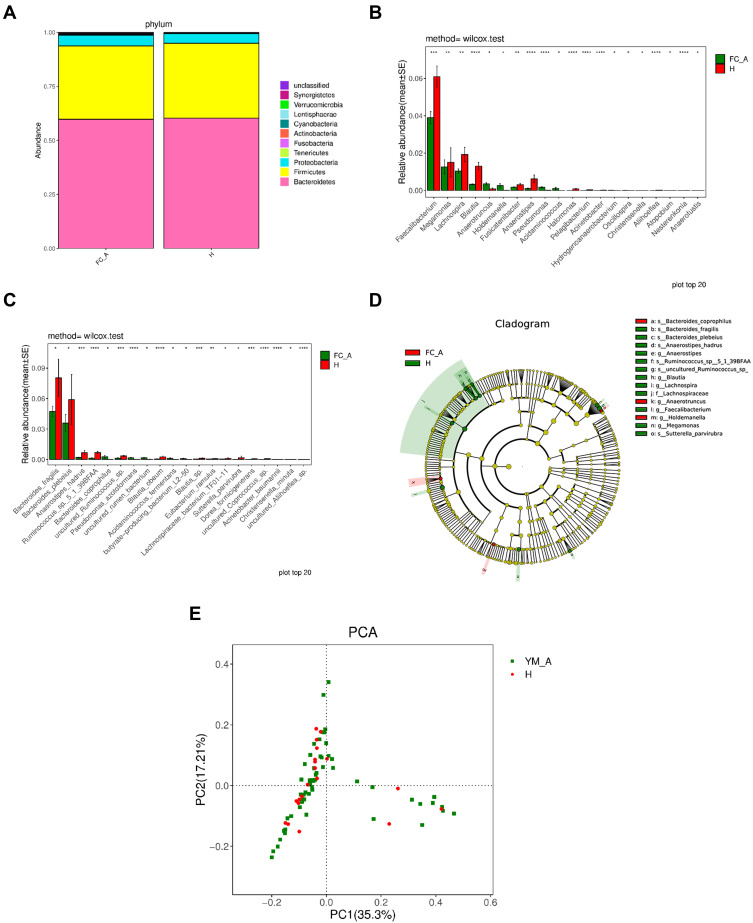
Figure 3.
Comparison of gut microbiota between elderly healthy controls and patients with chronic constipation. (A). Predominant phyla in both groups. (B). The relative abundance of genera that could distinguish chronic constipation from controls is plotted on a logarithmic scale, and values of zero are assigned 1e-06. *P < 0.05,**P < 0.001,***P < 0.0001,****P < 0.00001 (C). The relative abundance of species that could distinguish chronic constipation from controls is plotted on a logarithmic scale, and values of zero are assigned 1e-06.*P < 0.05, **P < 0.001,***P < 0.0001,****P < 0.00001 (D). Histogram of linear discriminant analysis scores for differently abundant genera. (E). PCoA diagram based on relative abundance (97% similarity). Each symbol represents a sample. Green symbol indicates patients with chronic constipation and red symbol represents healthy controls.

