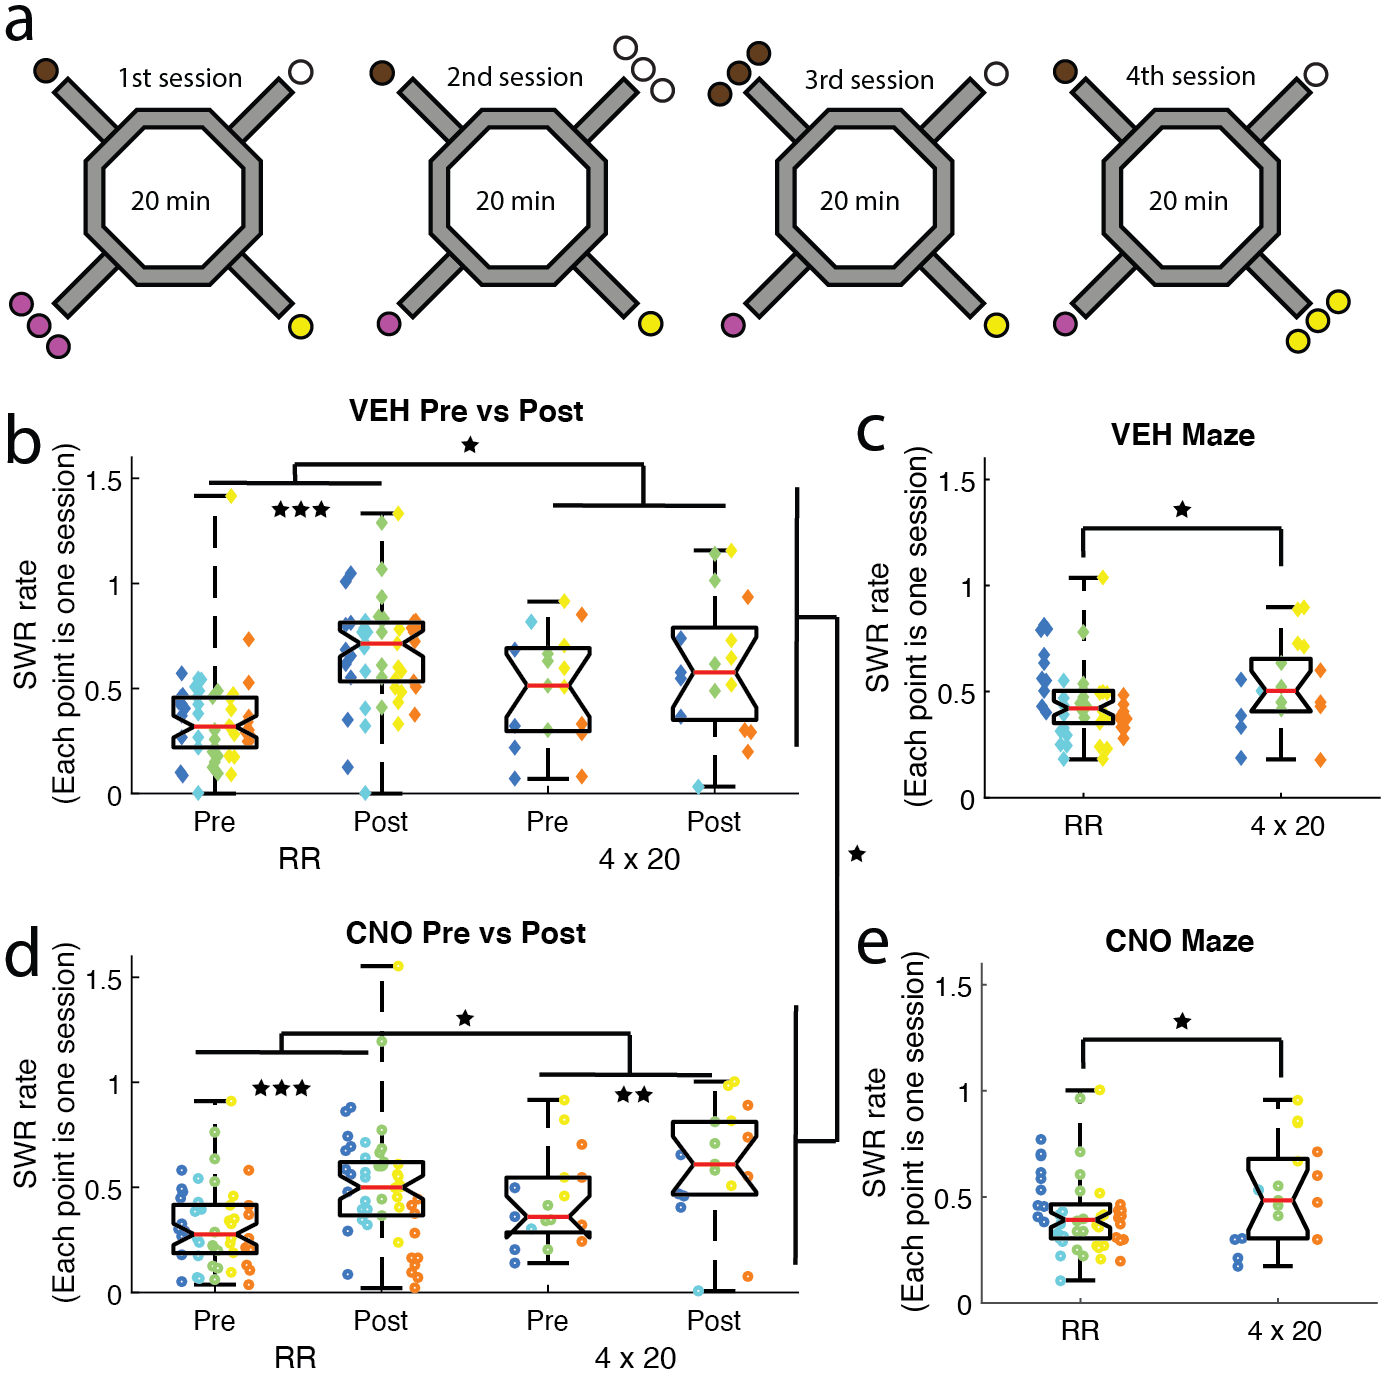
Figure 5: The 4 × 20 variant of Restaurant Row included 4 daily, 20-minute sub-sessions.

a) After completing the Restaurant Row task, rats were trained on the 4 × 20 variant. During each 20-minute sub-session one restaurant dispensed 3 pellets and the other three restaurants dispensed 1 pellet. A different flavor restaurant became the 3-pellet restaurant for each of the four daily sub-sessions (brown = chocolate, black = plain, yellow = banana, pink = cherry). b-e) SWR rates were compared between the over-trained Restaurant Row task and the novel 4 × 20 task. SWR rates were higher after the maze run (Pre → Post). These off-maze (Pre/Post) SWR rates increased on the 4 × 20 task from the Restaurant Row task for both b) VEH and d) CNO days. d) Disrupting the mPFC with CNO reduced SWR rates. Examining on-maze SWR rates revealed the same increase on the 4 × 20 task on both c) VEH and e) CNO days, but no overall effect of CNO. Boxplot center mark depicts the median (red line), and top and bottom edges represent first and third quartiles. Whiskers extend to extreme data points not considered outliers. Diamonds = VEH days, circles = CNO days; Different colors represent different rats * p < 0.05, ** p < 0.01, *** p < 0.001.
