
Figure 1.
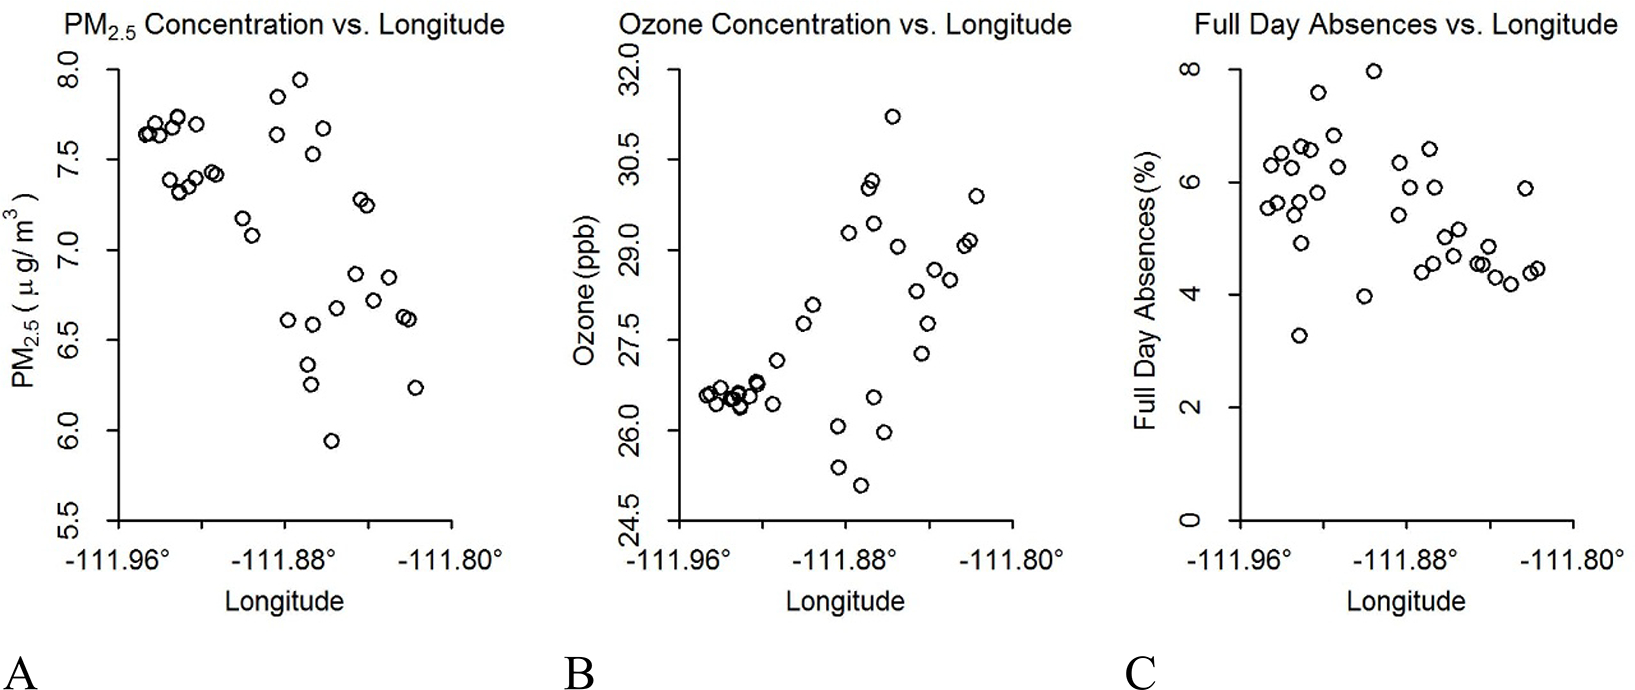
Pollutant concentrations and absences by longitude. Comparison between average annual outdoor pollutant concentrations and absences by longitude. Each circle represents a school location and its corresponding annual outdoor pollutant concentrations or absence rate: (A) fine particulate matter (PM2.5) vs. longitude, (B) ozone vs. longitude, and (C) absences vs. longitude.