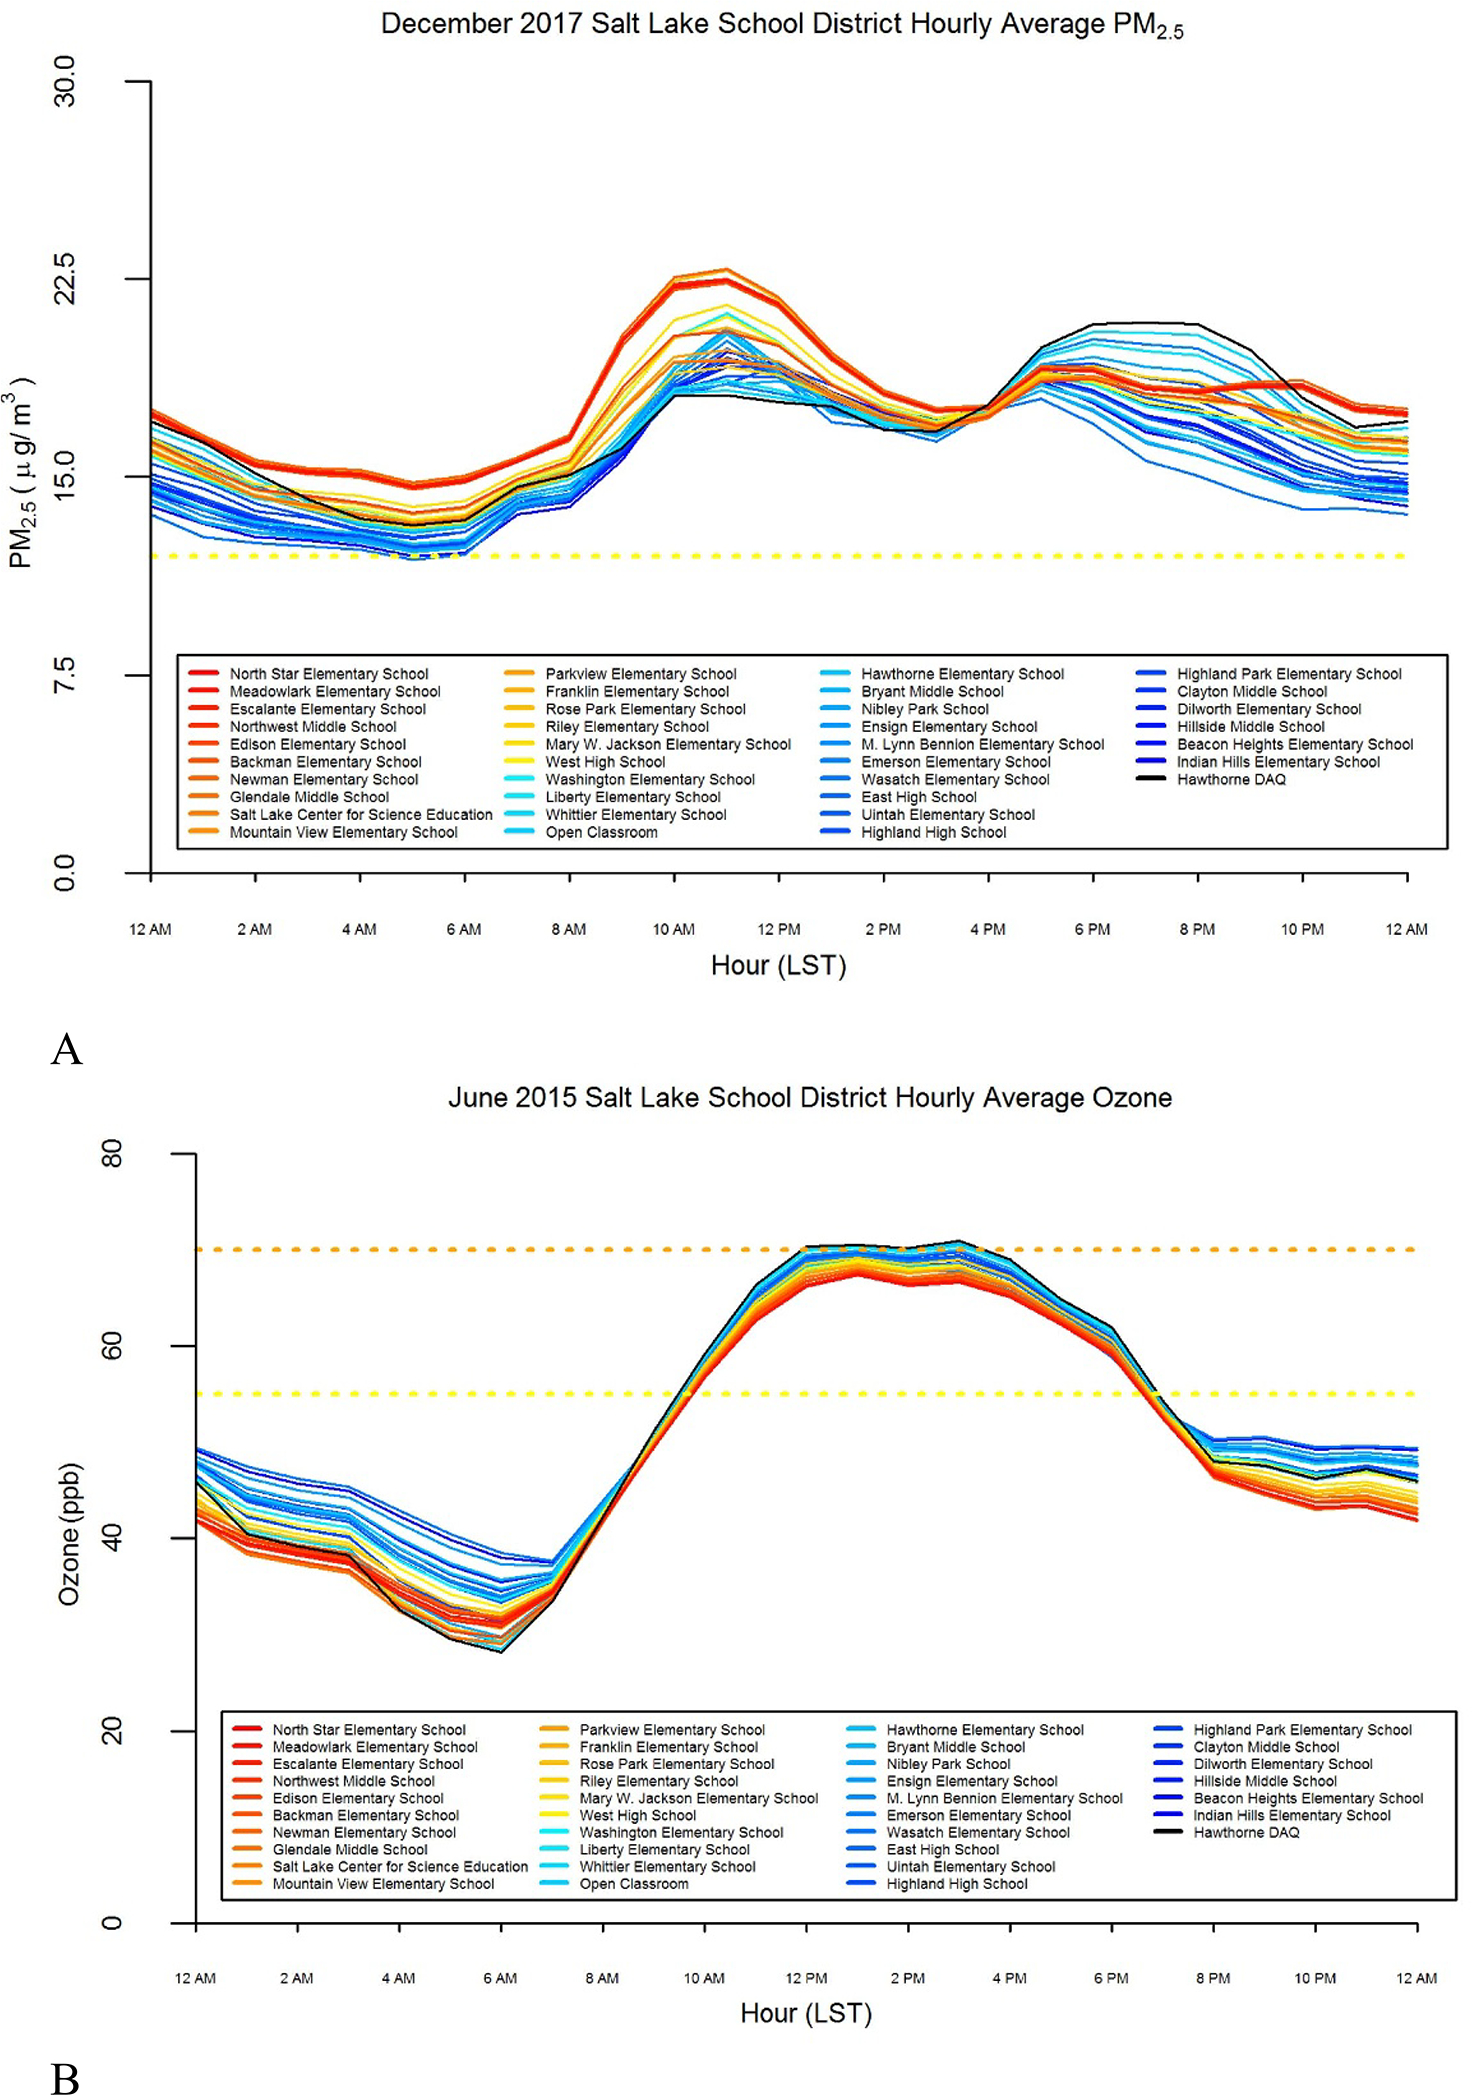
Figure 2.

Monthly hourly pollutant concentration averages. Diurnal patterns of (A) fine particulate matter (PM2.5) and (B) ozone across the Salt Lake City School District. The red colors represent schools farther west on the district, and blue represent schools farther east. The black line represents readings at the Division of Air Quality regulatory sensor. Dashed horizontal lines represent air quality index (AQI) levels. Observed hourly values are compared to 8-hour ozone and 24-hour PM2.5 values.
