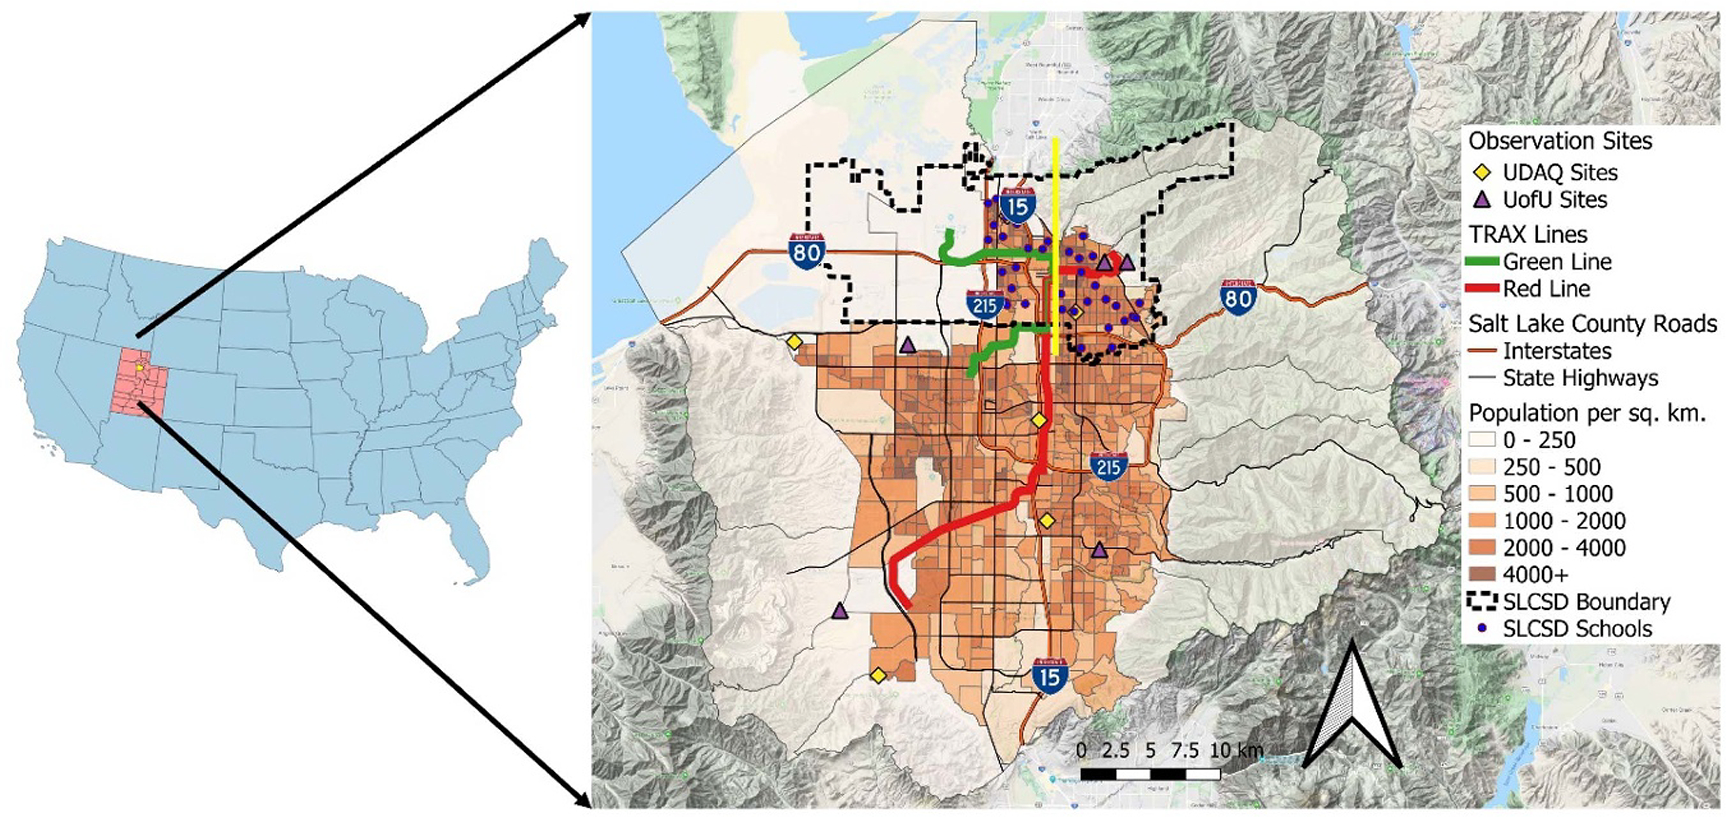
Figure A1.

Map of Salt Lake City School District (SLCSD) schools (blue circles), Utah Division of Air Quality (yellow diamonds) and University of Utah (purple triangles) stationary observation sites, light rail routes (green and red lines), interstate highways (orange lines), state highways (black lines), and population density (color gradient) of Salt Lake County, Utah. The solid yellow vertical line divides the SLCSD (dashed black outline) into the west and east sides.
