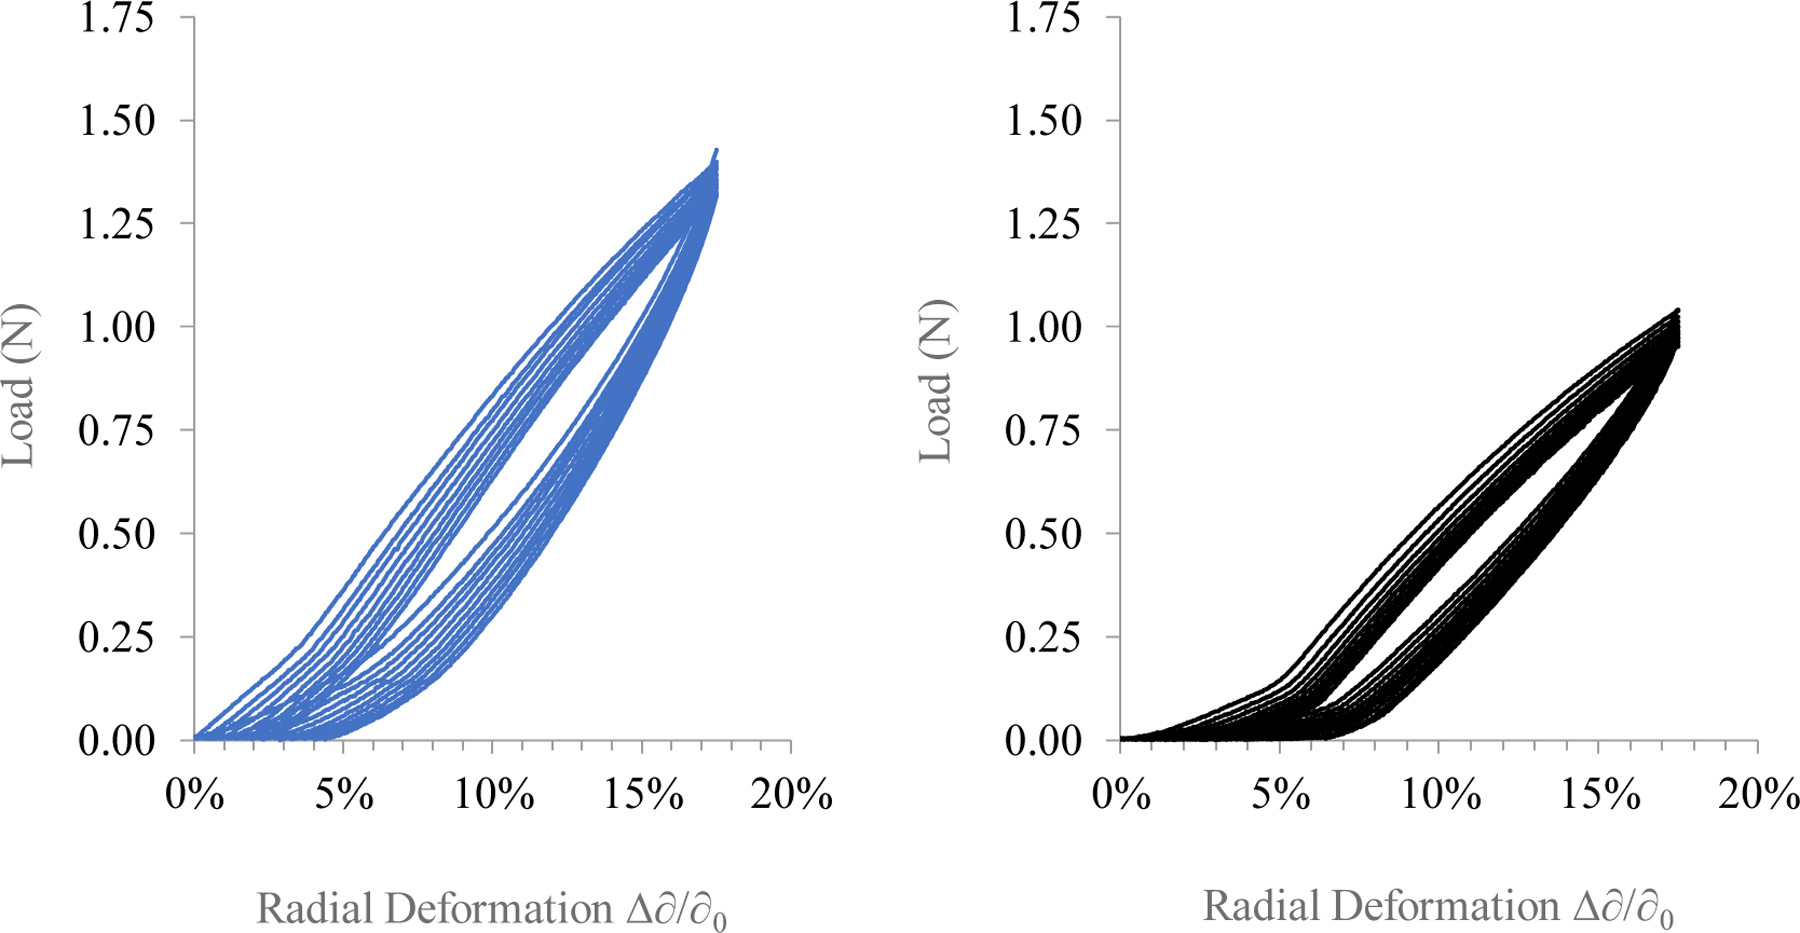
Figure 7.

Cyclic loading of AP-SDRs (Left) and SP-SDRs (Right) over a strain range of 0 – 17.5% for n = 10 cycles. Arrows indicate direction of hysteresis during cycle progression. Both systems experienced hysteresis (<10%) over the 14-minute loading cycle (0.7% per minute).
