
Fig. 7.
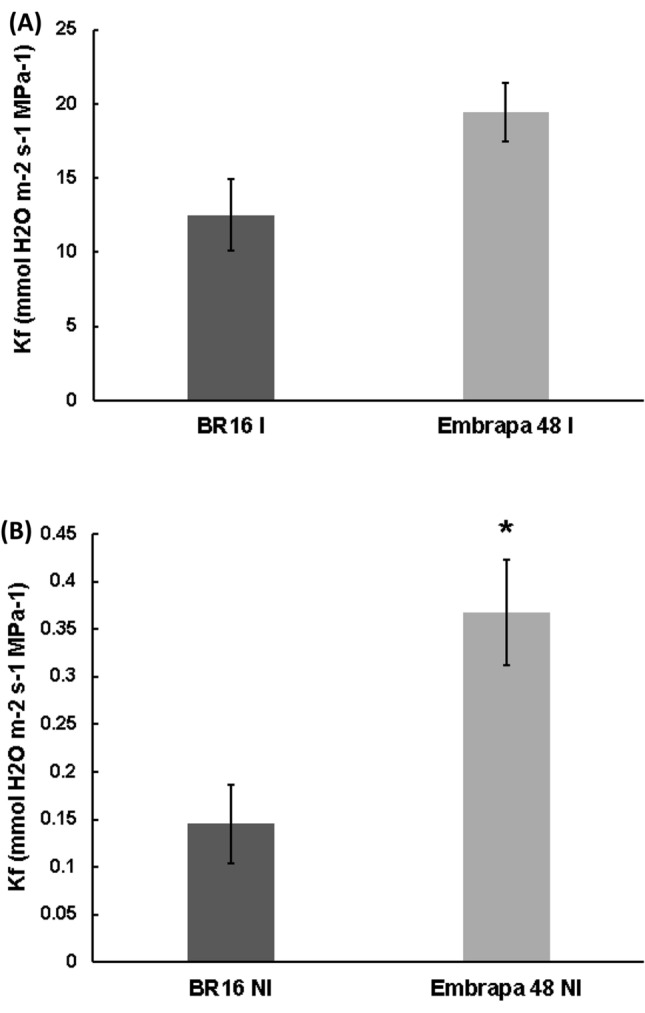
Leaf hydraulic conductance (Kf) of the soybean genotypes. Each bar represents the mean ± standard error (n = 5, where n represents the number of plants, t test p < 0.5). In a IR for irrigated and in b for NI non-irrigated treatments
Official websites use .gov
A
.gov website belongs to an official
government organization in the United States.
Secure .gov websites use HTTPS
A lock (
) or https:// means you've safely
connected to the .gov website. Share sensitive
information only on official, secure websites.
Leaf hydraulic conductance (Kf) of the soybean genotypes. Each bar represents the mean ± standard error (n = 5, where n represents the number of plants, t test p < 0.5). In a IR for irrigated and in b for NI non-irrigated treatments