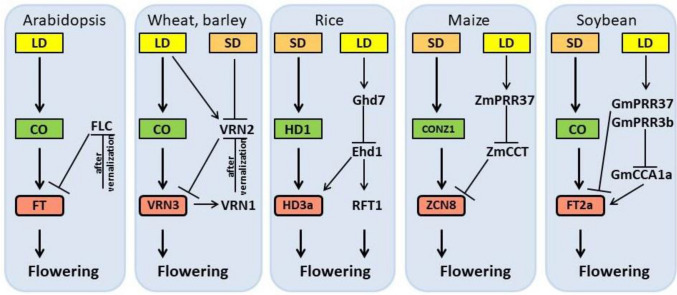
Fig. 1.
Simplified flowering regulatory networks in the model plant Arabidopsis and major crops wheat, barley, rice, maize, and soybean. Arrows indicate gene activation and flat-ended lines indicate gene repression. Green boxes represent homologs of Arabidopsis CONSTANS (CO) and red boxes represent homologs of Arabidopsis FLOWERING LOCUS T (FT). Yellow and orange boxes represent long-day (LD) and short-day (SD) condition, respectively

