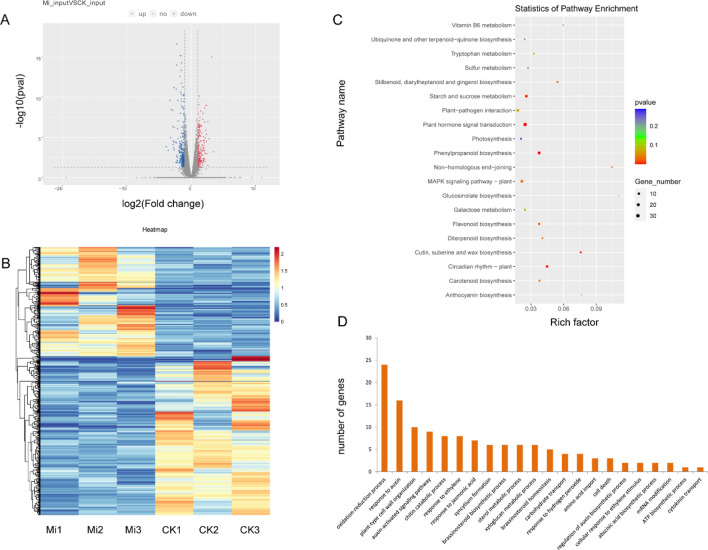
Fig. 5.
Differentially expressed genes (DEGs) in soybean roots under M. incognita-infected (Mi) and control (CK) conditions. (A) Volcano plot of up- (red) and downregulated (blue) genes between Mi and CK. Genes with |Log2(fold change)|≥ 1 and P ≤ 0.05 were considered to be differentially expressed. (B) Heatmap of RNA-seq data from Mi and CK samples. Rows, individual mRNA transcripts; columns, individual Mi and CK samples. Orange and blue represent upregulation and downregulation of mRNA levels in Mi and control samples, respectively. (C) KEGG enrichment of DEGs. (D) GO analysis of DEGs assigned to biological processes

