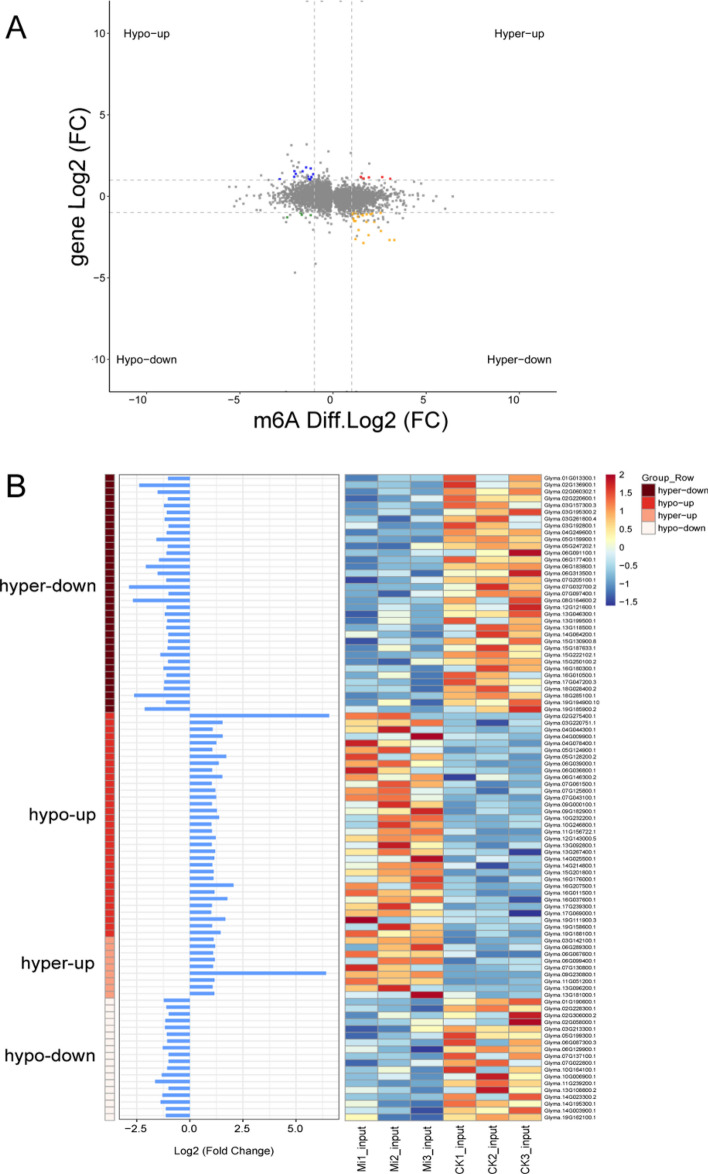
Fig. 7.
Conjoint analysis of m6A-seq and RNA-seq data. (A) A four-image map of differentially expressed genes (DEGs) and differential peaks that significantly changed in both m6A and mRNA levels in M. incognita-infected and control samples (fold change ≥ 1, P < 0.05). (B) Bar chart and heat map of the hyper-down, hypo-up, hyper-up, and hypo-down genes shown in A. Left, m6A-seq; right, RNA-seq

