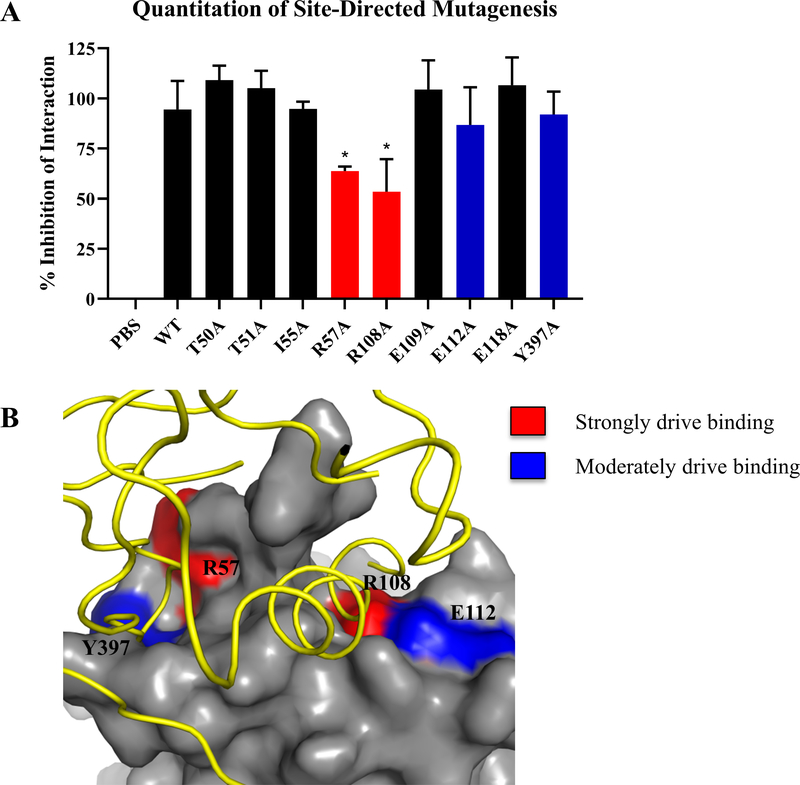
Figure 2: Validation of FAK residues predicted to be involved in HER2-FAK binding using site-directed mutagenesis.
(A) Quantitation of competitive GST pull-down assays with a series of FAK chFERM mutants. Mutations were selected based on HADDOCK molecular modeling studies. GST-FAK-NT:HER2-ICD pull-downs were competed with indicated FERM mutant and western blotting was performed to evaluate competition. Densitometry was performed to calculate % inhibition of interaction. Results are represented by three independent experiments (* denotes p < 0.05). (B) Protein-protein docking model of the HER2-FAK interaction as predicted by HADDOCK (Marlowe et al., 2016), showing the FERM regions that strongly drive binding to HER2 (R57 and R108) in red and those that moderately drive binding to HER2 (E112 and Y397) in blue. HER2 is colored in yellow and FAK is colored in gray.

