
Fig 6. Length, width of stomatal pore and number of stomata per microscopic field in high yielding mutants in M3 generation.
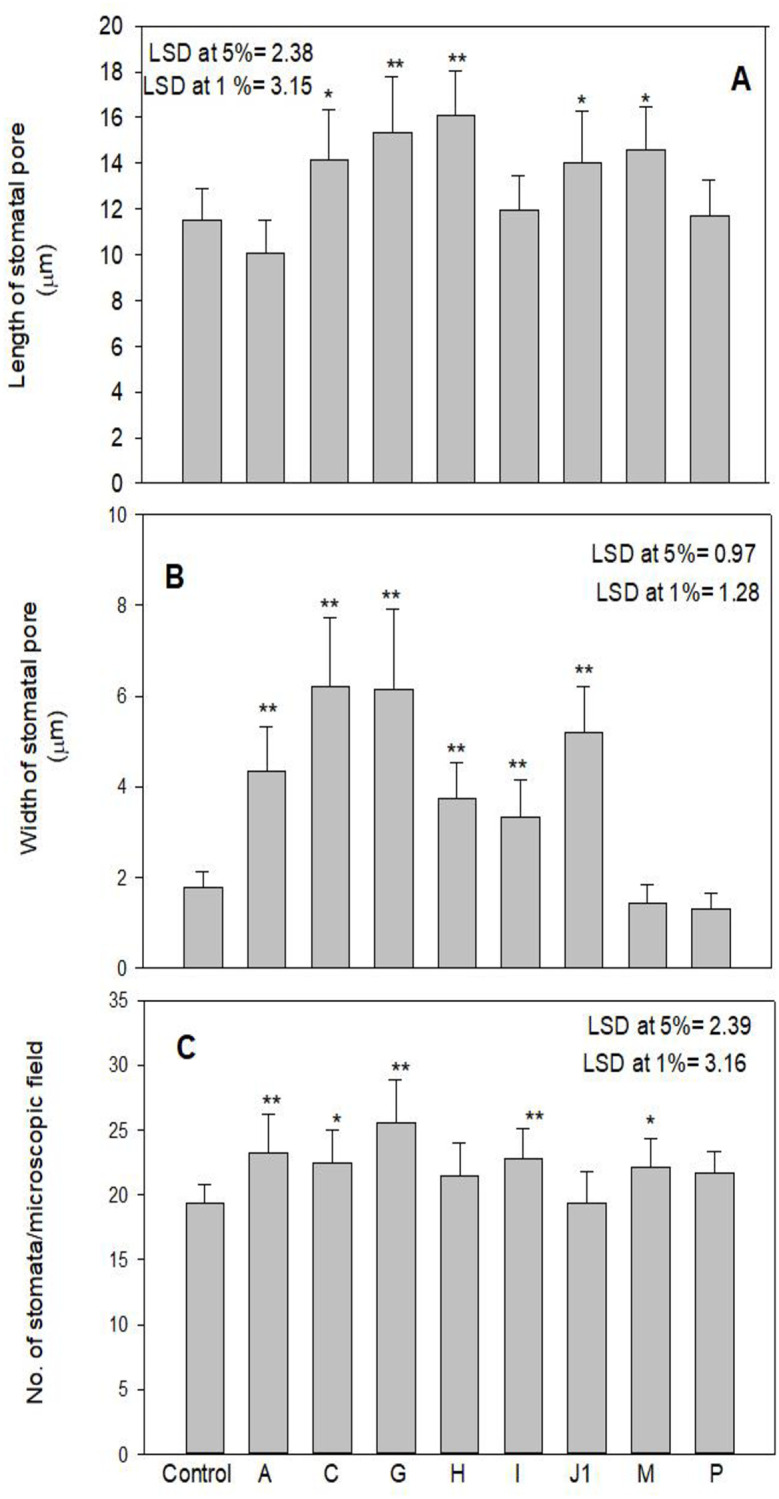
Results are expressed as Mean ±SE. Values with an asterisk (*) and (**) differ significantly at the 5% and 1% level (p< 0.05 and p< 0.01) respectively).