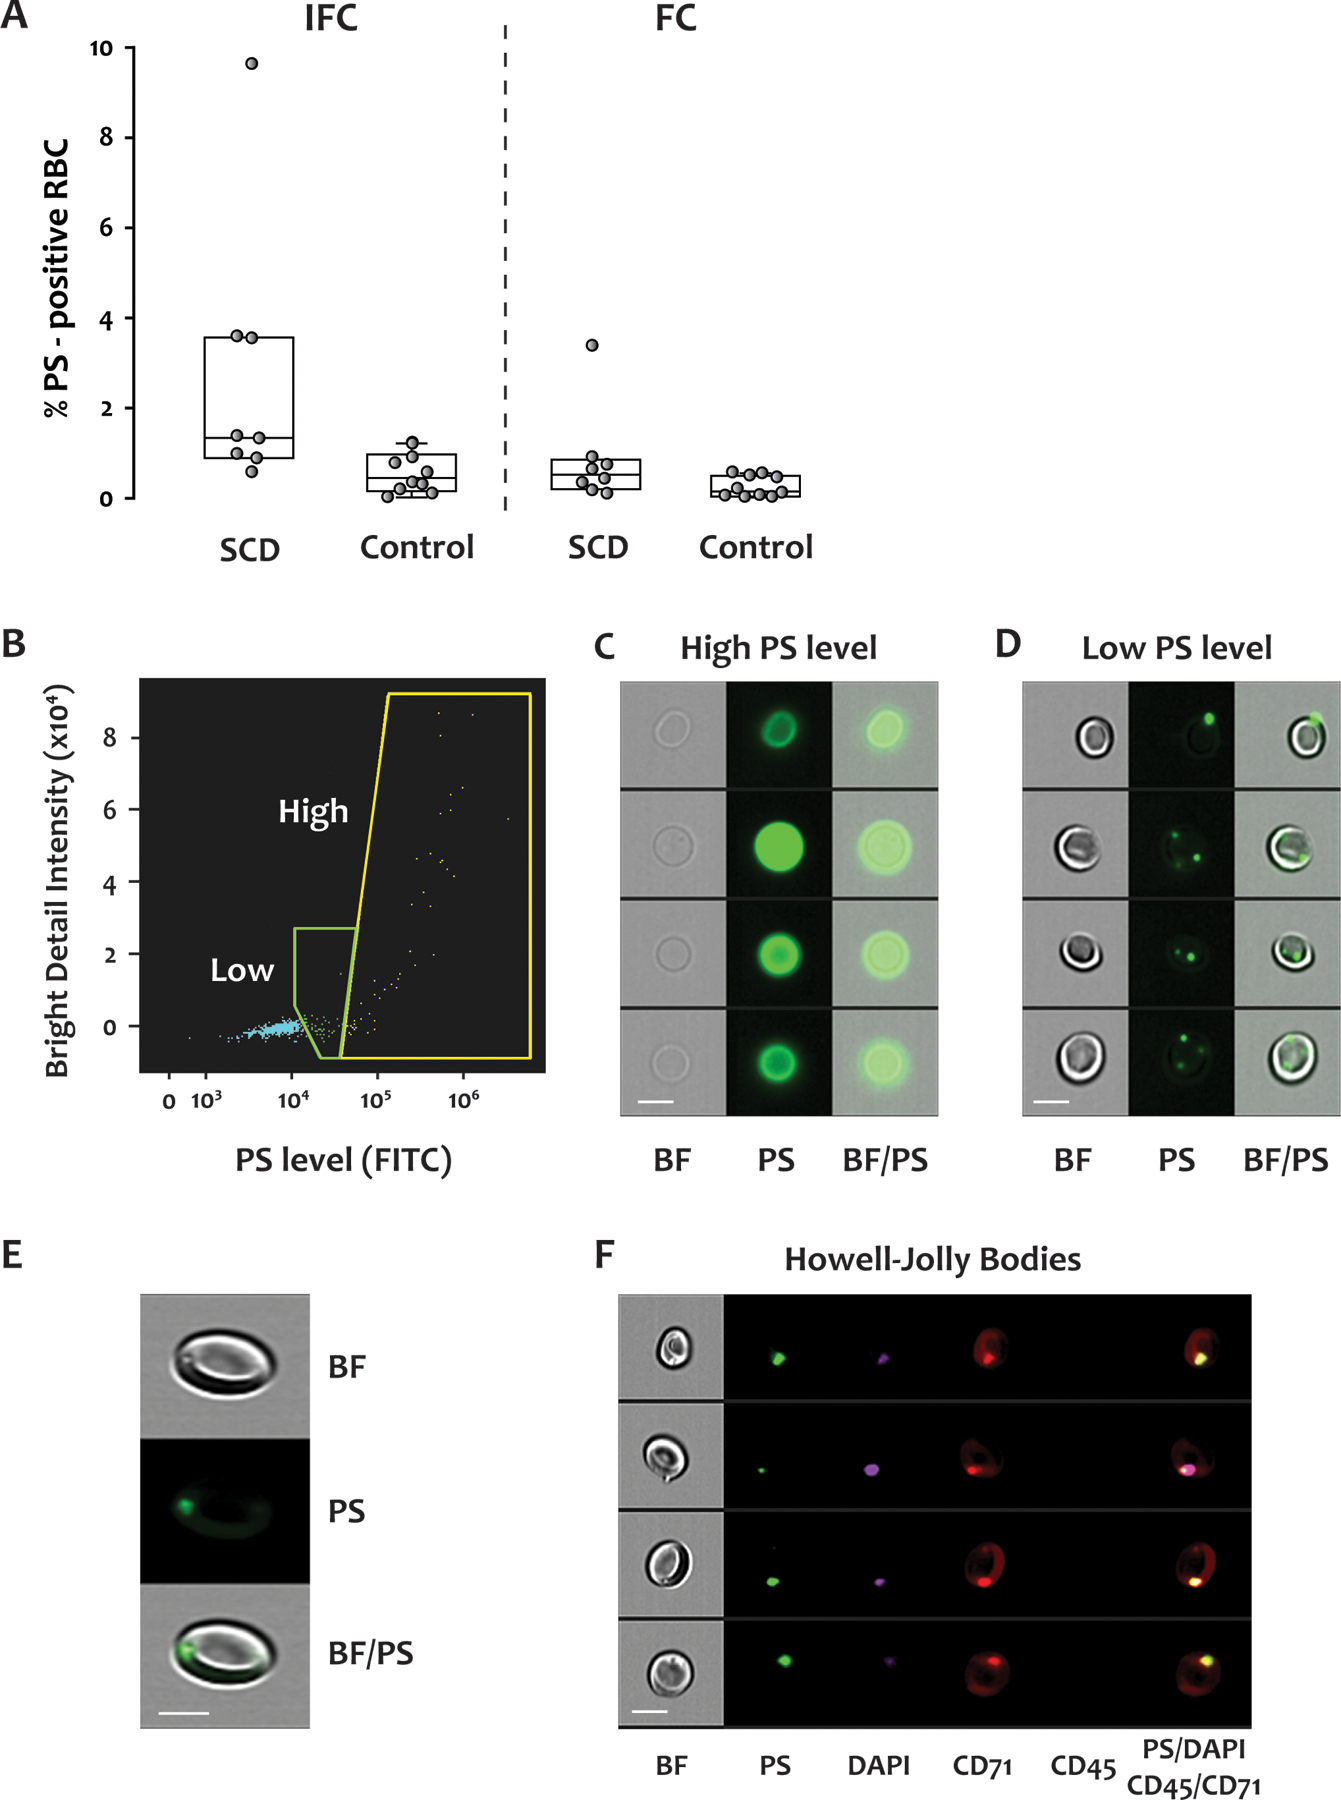
Figure 6. Phosphatidylserine (PS) exposure on RBCs from SCD patients and healthy donors.

FITC-conjugated lactadherin was used to detect PS exposure in blood from SCD patients and healthy donors. The samples were analyzed by both IFC and FC. Representative data from an SCD patient are shown in panels (B) to (F). (A) IFC detected significantly more PS-positive RBCs than did FC. By IFC, the percentage of PS-positive RBC was significantly greater in the SCD patients (median, IQR: 1.51%, 1.14–3.56%) than in the healthy donors (0.45%, 0.18–0.90%) (p = 0.003), but the difference detected by FC did not reach statistical significance (SCD: 0.53%, 0.25–0.82%, healthy donors: 0.16%, 0.05–0.49%, p = 0.06). Fourteen samples from 8 SCD patients, and 10 samples from 10 healthy donors were examined by both IFC and FC. (B) Scatter plot of bright detail intensity versus PS exposure (lactadherin staining) of RBCs. There were two populations of PS-positive cells, with either high or low (but detectable) PS exposure. Representative brightfield and fluorescent images of the two PS-positive populations are shown in (C) and (D). (E) Enlarged images show the dimples/black spots on the brightfield image, the PS dots on the fluorescent image, and their co-localization. (F) Representative images of brightfield and fluorescent staining for PS, DAPI, CD71, CD45, and their co-localization in reticulocytes. Scale bar: 7 μm. BF: brightfield, PS: phosphatidylserine, CD71: transferrin receptor, CD45: leukocyte common antigen.
