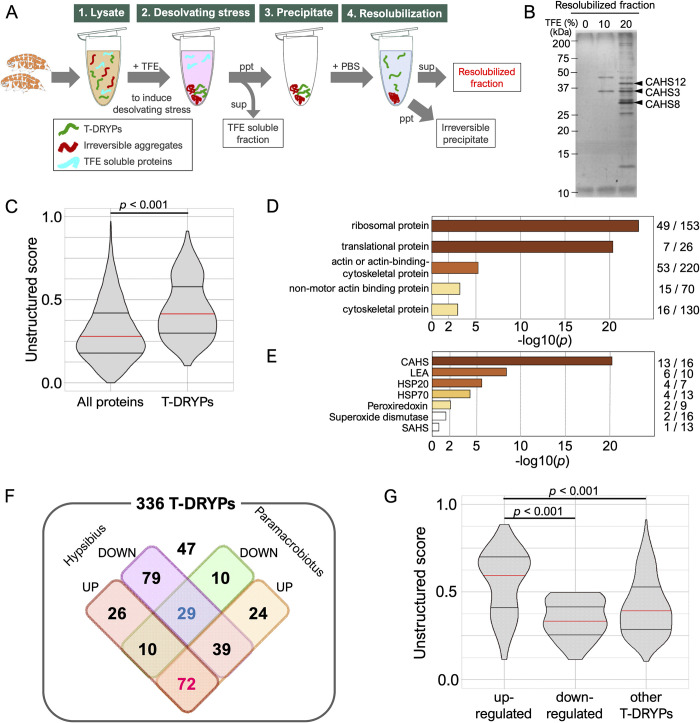
Fig 1. Isolation and characterization of T-DRYPs.
(A) Experimental scheme of T-DRYP isolation from tardigrade lysate. (B) SDS-PAGE image of the resolubilized fractions with 0%, 10%, or 20% TFE treatment. (C) Comparison of the unstructured score distributions between all tardigrade proteins and T-DRYPs. (D) Enrichment analysis of the PANTHER protein class in T-DRYPs. Ribosomal proteins and cytoskeletal proteins were significantly enriched. The numbers of the corresponding proteins detected in T-DRYPs and all tardigrade proteomes are shown on the right, respectively. (E) Enrichment analysis of stress-related proteins in T-DRYPs. CAHS proteins were significantly enriched in T-DRYPs. (F) Venn diagram of T-DRYPs classified by up- or down-regulation upon desiccation in orthologs of 2 other tardigrade species. (G) Comparison of unstructured score distributions among the differently regulated protein groups in T-DRYPs. “Up-regulated” and “down-regulated” indicate up-regulated or down-regulated proteins in both species, respectively. Proteins up-regulated upon desiccation exhibited higher unstructured scores. Red and 2 black horizontal bars in violin plot indicate the 50th, 25th, and 75th percentiles, respectively. Statistical analyses were performed with the Wilcoxon rank sum test in (C) and the Steel–Dwass test in (G). The underlying numerical data are available in S4 Data (C, D, and G) in S2 Data (E) and in S1 Data (F). CAHS, cytoplasmic-abundant heat-soluble; T-DRYP, TFE-dependent reversibly condensing protein; TFE, trifluoroethanol.

