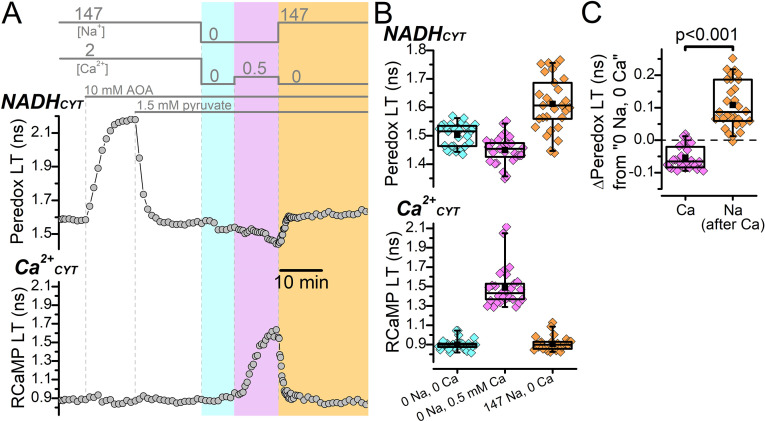
Figure 2. Malate-aspartate shuttle activity does not conceal a possible NADHCYT increase produced by elevated Ca2+CYT.
(A) Representative fluorescence lifetime (LT) traces of Peredox (top) and RCaMP (bottom) from a DGC. External solution changes are indicated by the bars above the Peredox trace. The recording begins in ACSF (147 mM Na+ and 2 mM Ca2+), where the addition of 10 mM AOA strongly increases the Peredox LT. Addition of 1.5 mM pyruvate reverted the Peredox LT approximately back to baseline. Following this, external Na+ and Ca2+ were removed (cyan shading), which slightly decreased the Peredox LT. The addition of 0.5 mM Ca2+ in 0 Na+ to stimulate reverse NCX transport increased the RCaMP LT and further decreased the Peredox LT (magenta shading). Subsequently, the removal of external Ca2+ and re-addition of external Na+ to stimulate forward NCX transport (orange shading) increased the Peredox LT and brought the RCaMP LT back to baseline. (B) Box plots of the Peredox (top) and RCaMP (bottom) fluorescence LTs in the different external solution conditions performed in (A), across many DGCs (n=29). The external [Na+] and [Ca2+] condition after applying AOA and pyruvate is listed across the bottom in chronological order from left to right. The coloring of the data corresponds to the shading in A. The mean Peredox and RCaMP LTs in each external condition were (in ns): 1.50±0.04 in 0 Na+ and 0 Ca2+, 1.45±0.05 in 0 Na+ and 0.5 mM Ca2+, and 1.61±0.09 in 147 Na+ and 0 Ca2+. The mean RCaMP LTs were (in ns): 0.90±0.06 in 0 Na+ and 0 Ca2+, 1.49±0.20 in 0 Na+ and 0.5 mM Ca2+, and 0.91±0.07 in 147 Na+ and 0 Ca2+. (C) Relative change to the Peredox fluorescence LT induced by the addition of 0.5 mM Ca2+ in the absence of external Na+ to stimulate reverse NCX transport (Ca) or 147 mM Na+ in the absence of external Ca2+ to stimulate forward NCX transport (Na). The data are from the same DGCs as in (B). The mean ∆Peredox values were: –0.05±0.04 ns for ‘Ca’ and 0.11±0.07 ns for ‘Na’. Statistical significance from a paired Wilcoxon test is indicated.

