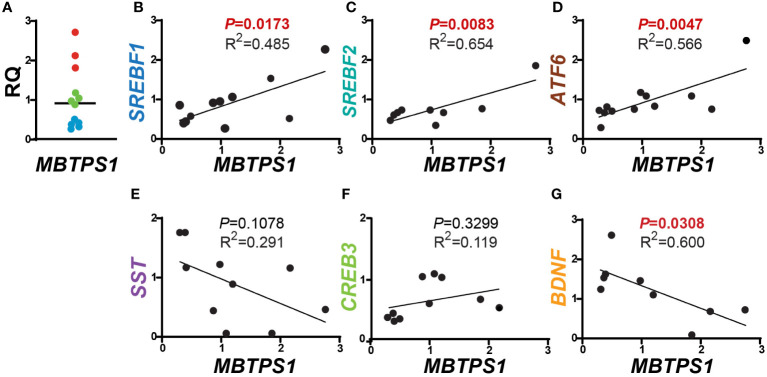
Figure 1.
Correlations between MBTPS1 levels and its downstream targets in human CRC. (A) Relative MBTPS1 mRNA levels in tumors compared to normal surrounding tissue obtained from the same patient (n=12 patients). Note that while in some patients the levels of MBTPS1 are unchanged (green circles), in others the levels are markedly elevated (red circles) or markedly reduced (light blue circles). (B–D) Positive correlation between MBTPS1 and three MBTPS1 targets: SREBF1 (r = 0.6963, P = 0.0173), SREBF2 (r = 0.8086, P =0.0083) and ATF6 (r = 0.7526, P = 0.0047). (E, F) No correlation between MBTPS1 and SST (r = -0.5691, P = 0.1078) or CREB3 (r = 0.3443, P = 0.3299). (G) A negative correlation between MBTPS1 and BDNF (r = -0.7138, P = 0.0308).

