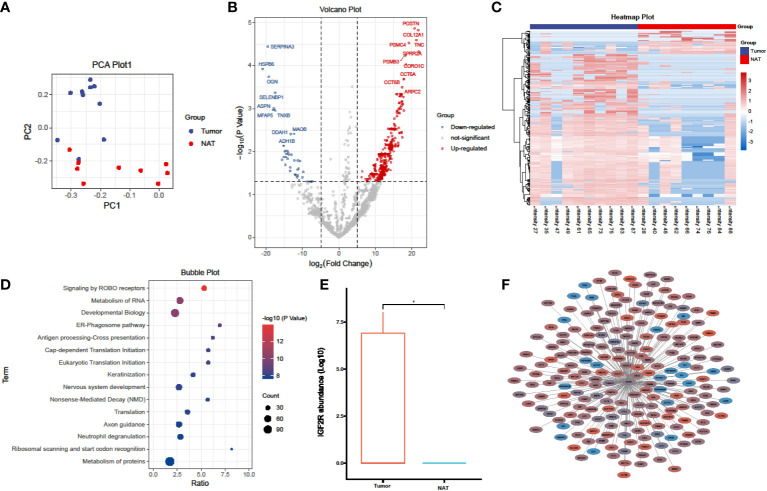
Figure 1.
Proteomics analysis comparing laryngeal cancer to adjacent normal tissues. (A) PCA plots of the proteins identified in laryngeal cancer and adjacent normal tissues (laryngeal cancer tissue, n = 10; adjacent normal tissues, n = 9). (B) Volcano plot showing the DEPs in laryngeal cancer and adjacent normal tissues. (C) A heatmap illustrating the expression of DEPs in laryngeal cancer and adjacent normal tissues; each row represents one protein, and each column represents one sample. (D) A bubble plot depicting the enriched KEGG pathways of DEPs identified in laryngeal cancer and adjacent normal tissues. (E) A box plot of IGF2R protein expression in laryngeal cancer and adjacent normal tissues. *p < 0.05, student’s t test. (F) Network analysis of the correlation between DEPs and IGF2R (|R| > 0.5, P < 0.05), line thickness represents the strength of the correlation, blue represents downregulation, and red represents upregulation.

