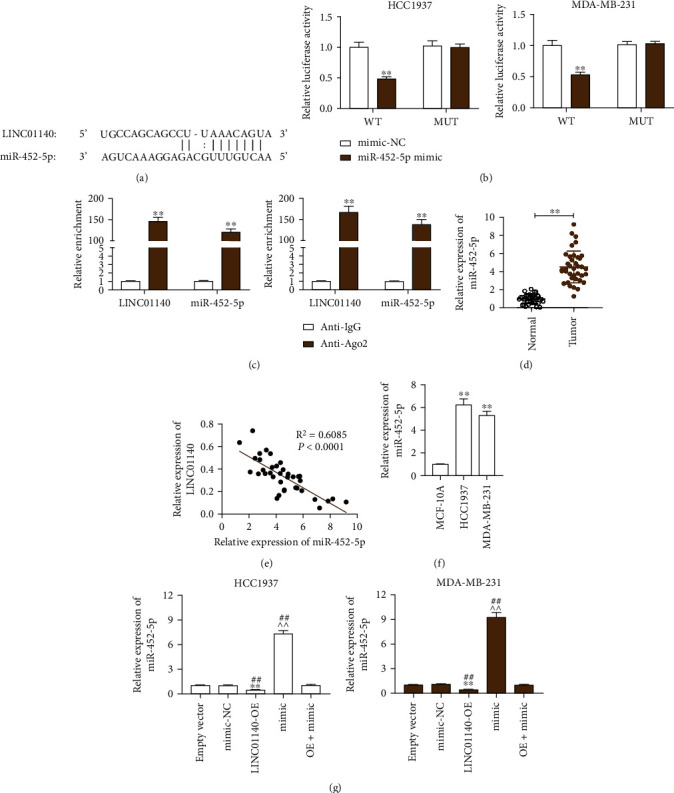
Figure 3.

LINC01140 sponged miR-452-5p (a) StarBase was utilized for the prediction of miR-452-5p binding sites on LINC01140. (b) Luciferase reporter experiment was conducted to measure the luciferase activities among MDA-MB-2312 and HCC1937 cells that had a combined transfection of a miR-452-5p mimic or miR-NC plus either a LINC01140-WT or LINC01140-MUT reporter plasmid. ∗∗P < 0.001 vs mimic-NC. (c) MiR-452-5p and LINC01140 enrichment levels on anti-Ago2 bind magnetic beads, as determined via RIP assay. ∗∗P < 0.001 vs anti-IgG. (d) RT-qPCR was utilized for measuring miR-452-5p expression in BC as well as adjacent tissues. ∗∗P < 0.001. (e) The association between the expressions of miR-452-5p and LINC01140 in BC tissues was analyzed by Pearson analysis. (f) RT-qPCR was utilized for the determination of miR-452-5p expression in normal MCF-10A cells and BC cells (HCC1937 and MDA-MB-231). ∗∗P < 0.001 vs MCF-10A. (g) RT-qPCR was utilized for measuring miR-452-5p expression in empty vector, mimic-NC, LINC01140-OE (OE), mimic or OE+mimic transfected HCC1937, and MDA-MB-231 cells. ∗∗P < 0.001 vs empty vector; ^^P < 0.001 vs mimic-NC; ##P < 0.001 vs OE+mimic.
