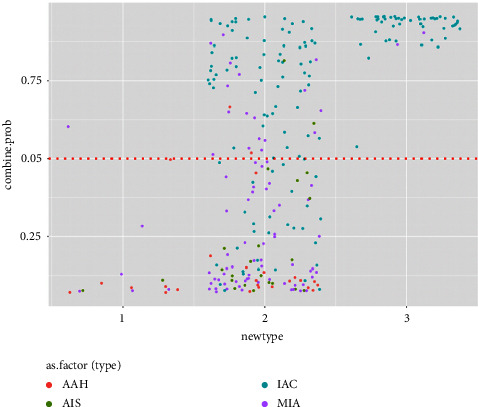
Figure 8.

Jitter plot of nodule classifications with their model predictive values. It illustrates that using a model predictive value of 0.5 (shown with a red dot) as the cut-off, a correct reclassification with respect to histological invasiveness would be identified, especially for type 2 nodules.
