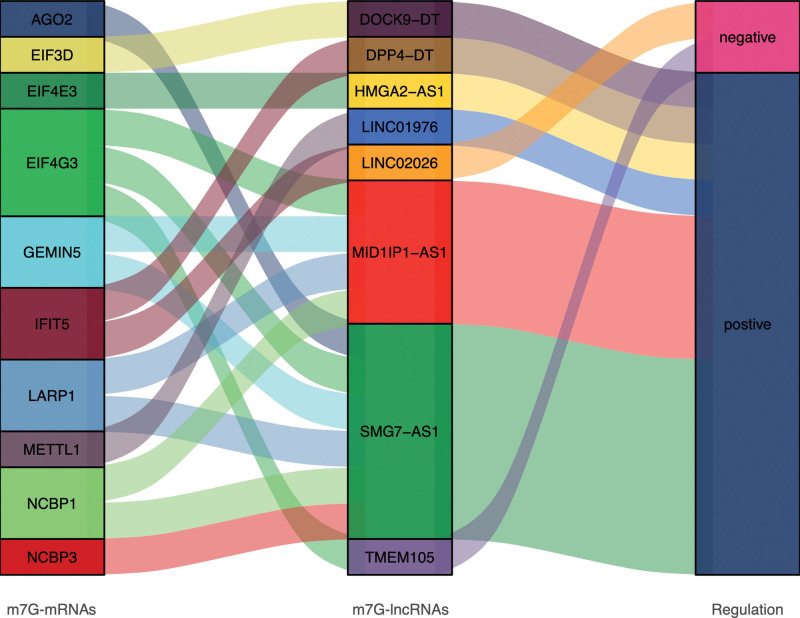
Figure 4.
The sankey diagram showed the regulatory relationship between 8 PDEm7G-lncRNAs and 10 PDEm7G-mRNAs. The blocks on the left represent the PDEm7G-mRNAs, the middle blocks represent PDEm7G-lncRNAs, and the blocks on the right represent the regulatory relationships (PCC > 0.4 and P < .05). PCC = pear son correlation coefficient, PDEm7G-lncRNAs = N7-methylguanosine modification-related mRNAs, PDEm7G-mRNAs = differentially expressed m7G-related lncRNAs.

