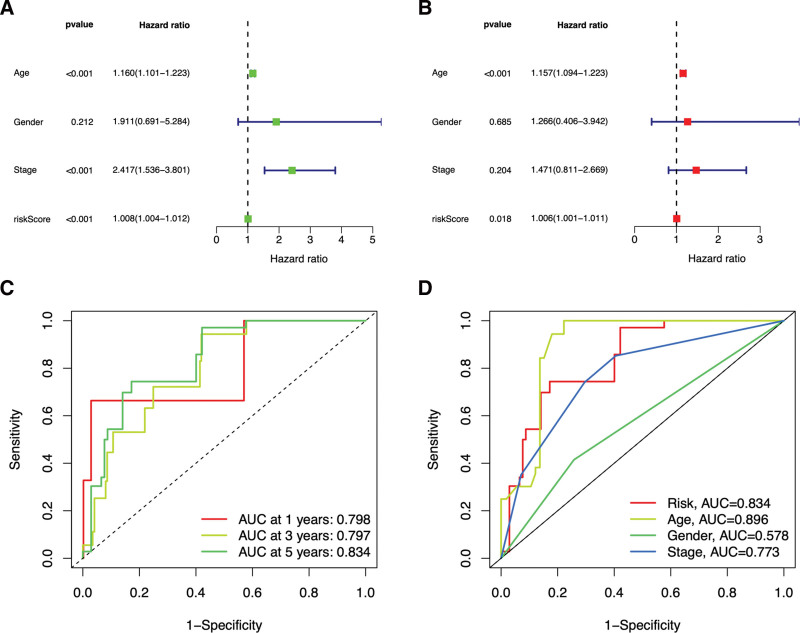
Figure 7.
Forest plots of univariate (A) and multivariate (B) logistic analysis of clinical characteristics in THCA patients. Green or red square represents HR value, blue solid lines represent 95% confidence intervals. ROC curves of the prognosis model. The different colored curves represent different survival rates (1-,3- and 5-year) (C) or clinical characteristics (D), AUC = area under the ROC curve, Abscissa = 1-Specificity (false positive rate), HR = hazard ratio, ordinate = Sensitivity (true positive rate), ROC = receiver operating characteristic, THCA = thyroid cancer.

