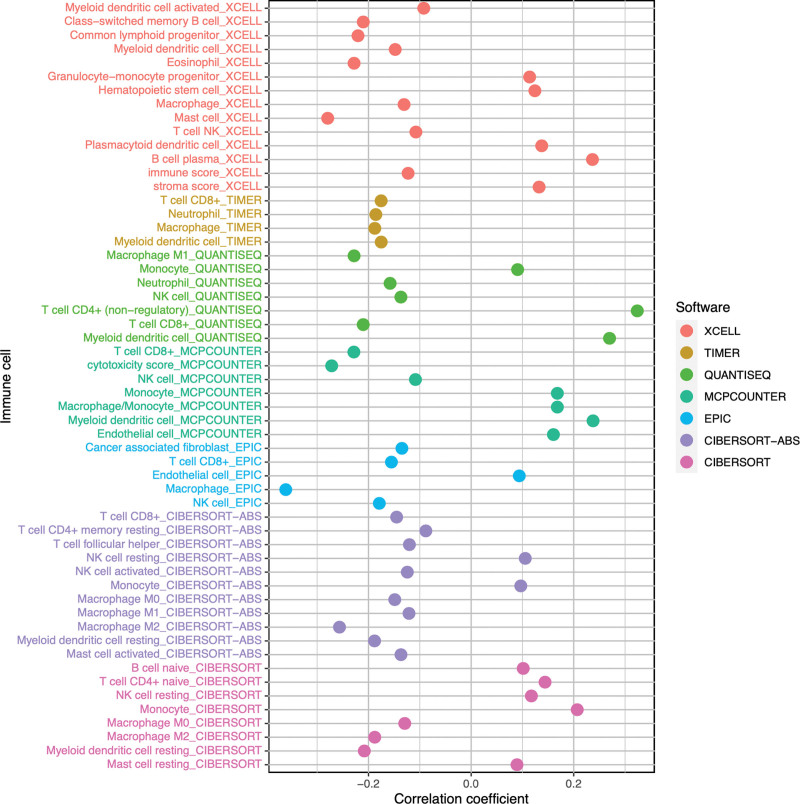
Figure 8.
Bubble plot of correlation between immune cells and risk scores. The vertical axis represents the name of the immune cells, the horizontal axis represents the correlation coefficient between the THCA patient’s risk scores and the immune cells, and the colored circles represent the results predicted by different bioinformatics software. THCA = thyroid cancer.

