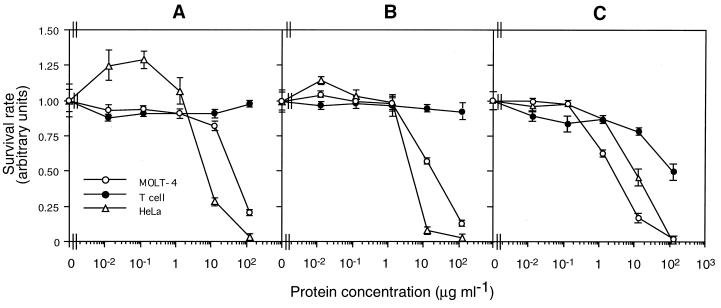
FIG. 7.
Dose-response curves of cytotoxicity associated with proteinase K-treated parasporal inclusion proteins of B. thuringiensis strain 84-HS-1-11 (A), the recombinant B. thuringiensis(pLEUK3.4S) (B), and the type strain of B. thuringiensis serovar Israelensis (C) against MOLT-4, normal T, and HeLa cells. The vertical bar represents the standard deviation.

