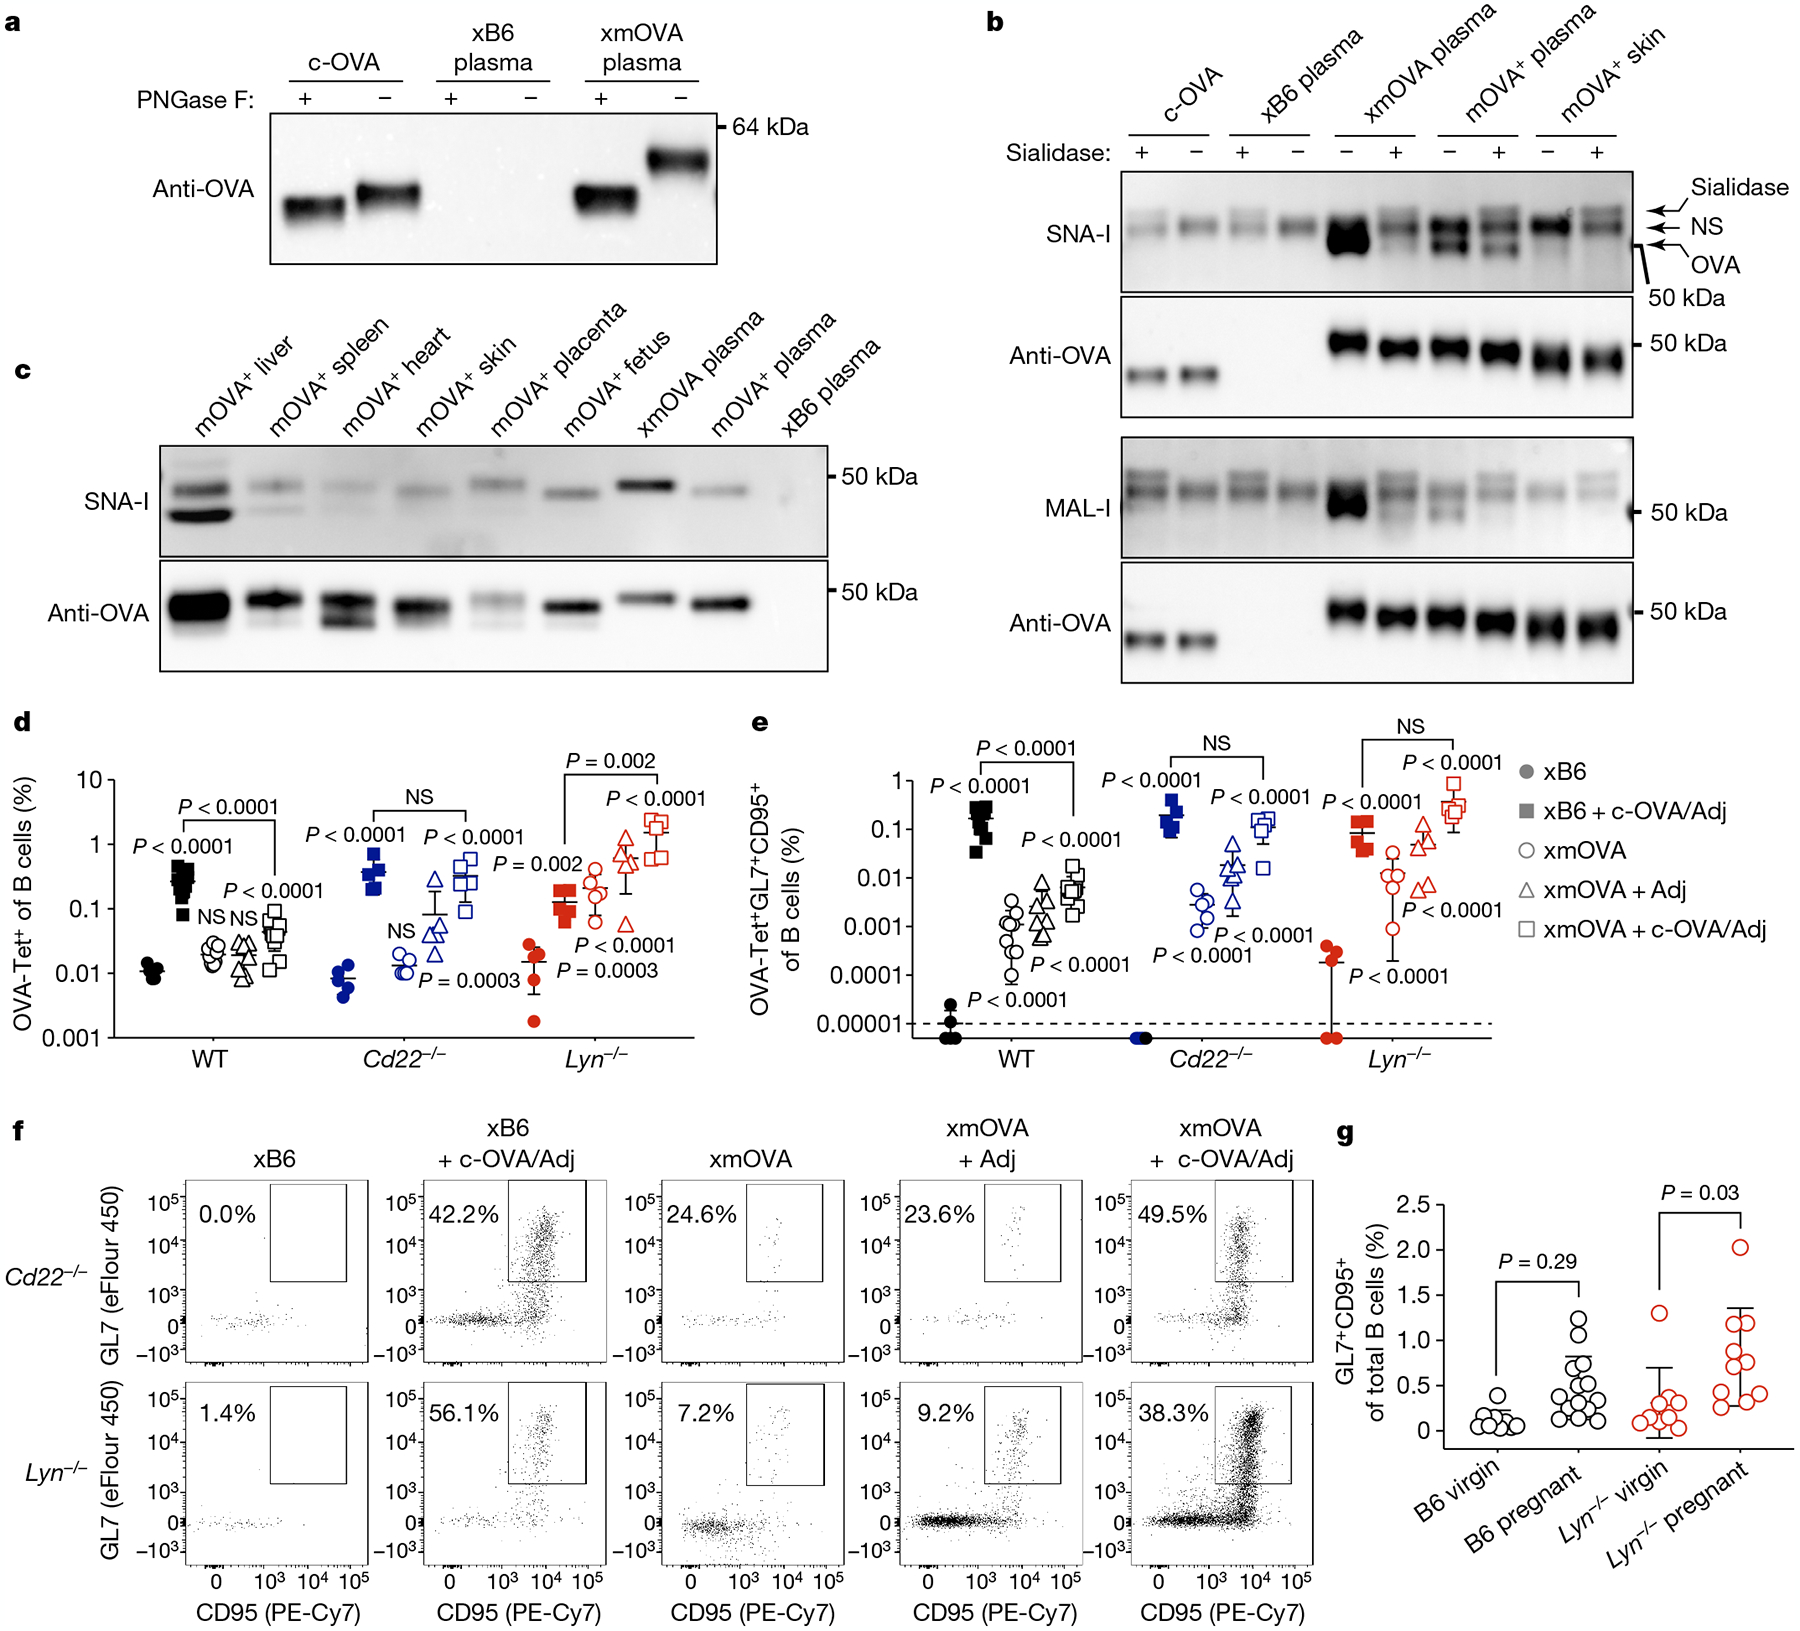
Fig. 3 |. CD22 and LYN mediate t-mOVA-induced B cell suppression.

a, Extensive N-linked glycosylation of t-mOVA. Equal volumes of pooled plasma (n = 3 mice per group (E16.5–E18.5)) were subjected to anti-OVA immunoprecipitation, deglycosylation by PNGase F digestion as indicated, then anti-OVA immunoblotting. c-OVA was analysed in parallel. b, t-mOVA sialylation. OVA from various sources was subjected to anti-OVA immunoprecipitation, sialidase digestion as indicated, then lectin blotting. Plasma came from n = 3–4 pooled xB6 pregnant WT, xmOVA pregnant WT (both E15.5–E17.5) or non-pregnant Act-mOVA (mOVA+) transgenic females; skin came from non-pregnant mOVA+ transgenic females. Each lectin blot was stripped and re-probed with anti-OVA antibodies. A nonspecific (NS) species and the sialidase itself was detected on the lectin blots. c, α(2,6)-Sia prevalence on mOVA from various tissues of Act-mOVA mice. OVA was immunoprecipitated from tissue homogenates or plasma (as in b) and subjected to SNA-I blotting, then anti-OVA immunoblotting. Blots in a–c are each representative of two to three experiments, each with independent biological replicates. For gel source data, see Supplementary Fig. 1.d–f, Representative flow plots (f), frequencies of total (d) or GL7+CD95+ GC phenotype (e) OVA-specific B cells 6 days after vaccination as described in Fig. 2c–e. WT data are from Fig. 2c, d. The flow plots show OVA-Tet+ B cells gated from a fixed number of total B cells across all groups. Adjusted P values were determined by ordinary one-way ANOVA with Sidak’s multiple comparisons test as described in Fig. 1. Bars show mean ± s.d. Lyn−/− and Cd22−/− data were accumulated over 14 and 11 independent experiments, respectively, and all mice are displayed. g, B cell responses to presumptive endogenous trophoblast antigens. For pregnant mice, splenic B cells were analysed on E18.5 and combine data from n = 5–9 xB6 mice and n = 5 xmOVA mice per group. Adjusted P values were determined by ordinary one-way ANOVA with Sidak’s multiple comparisons test. Bars show mean ± s.d.
