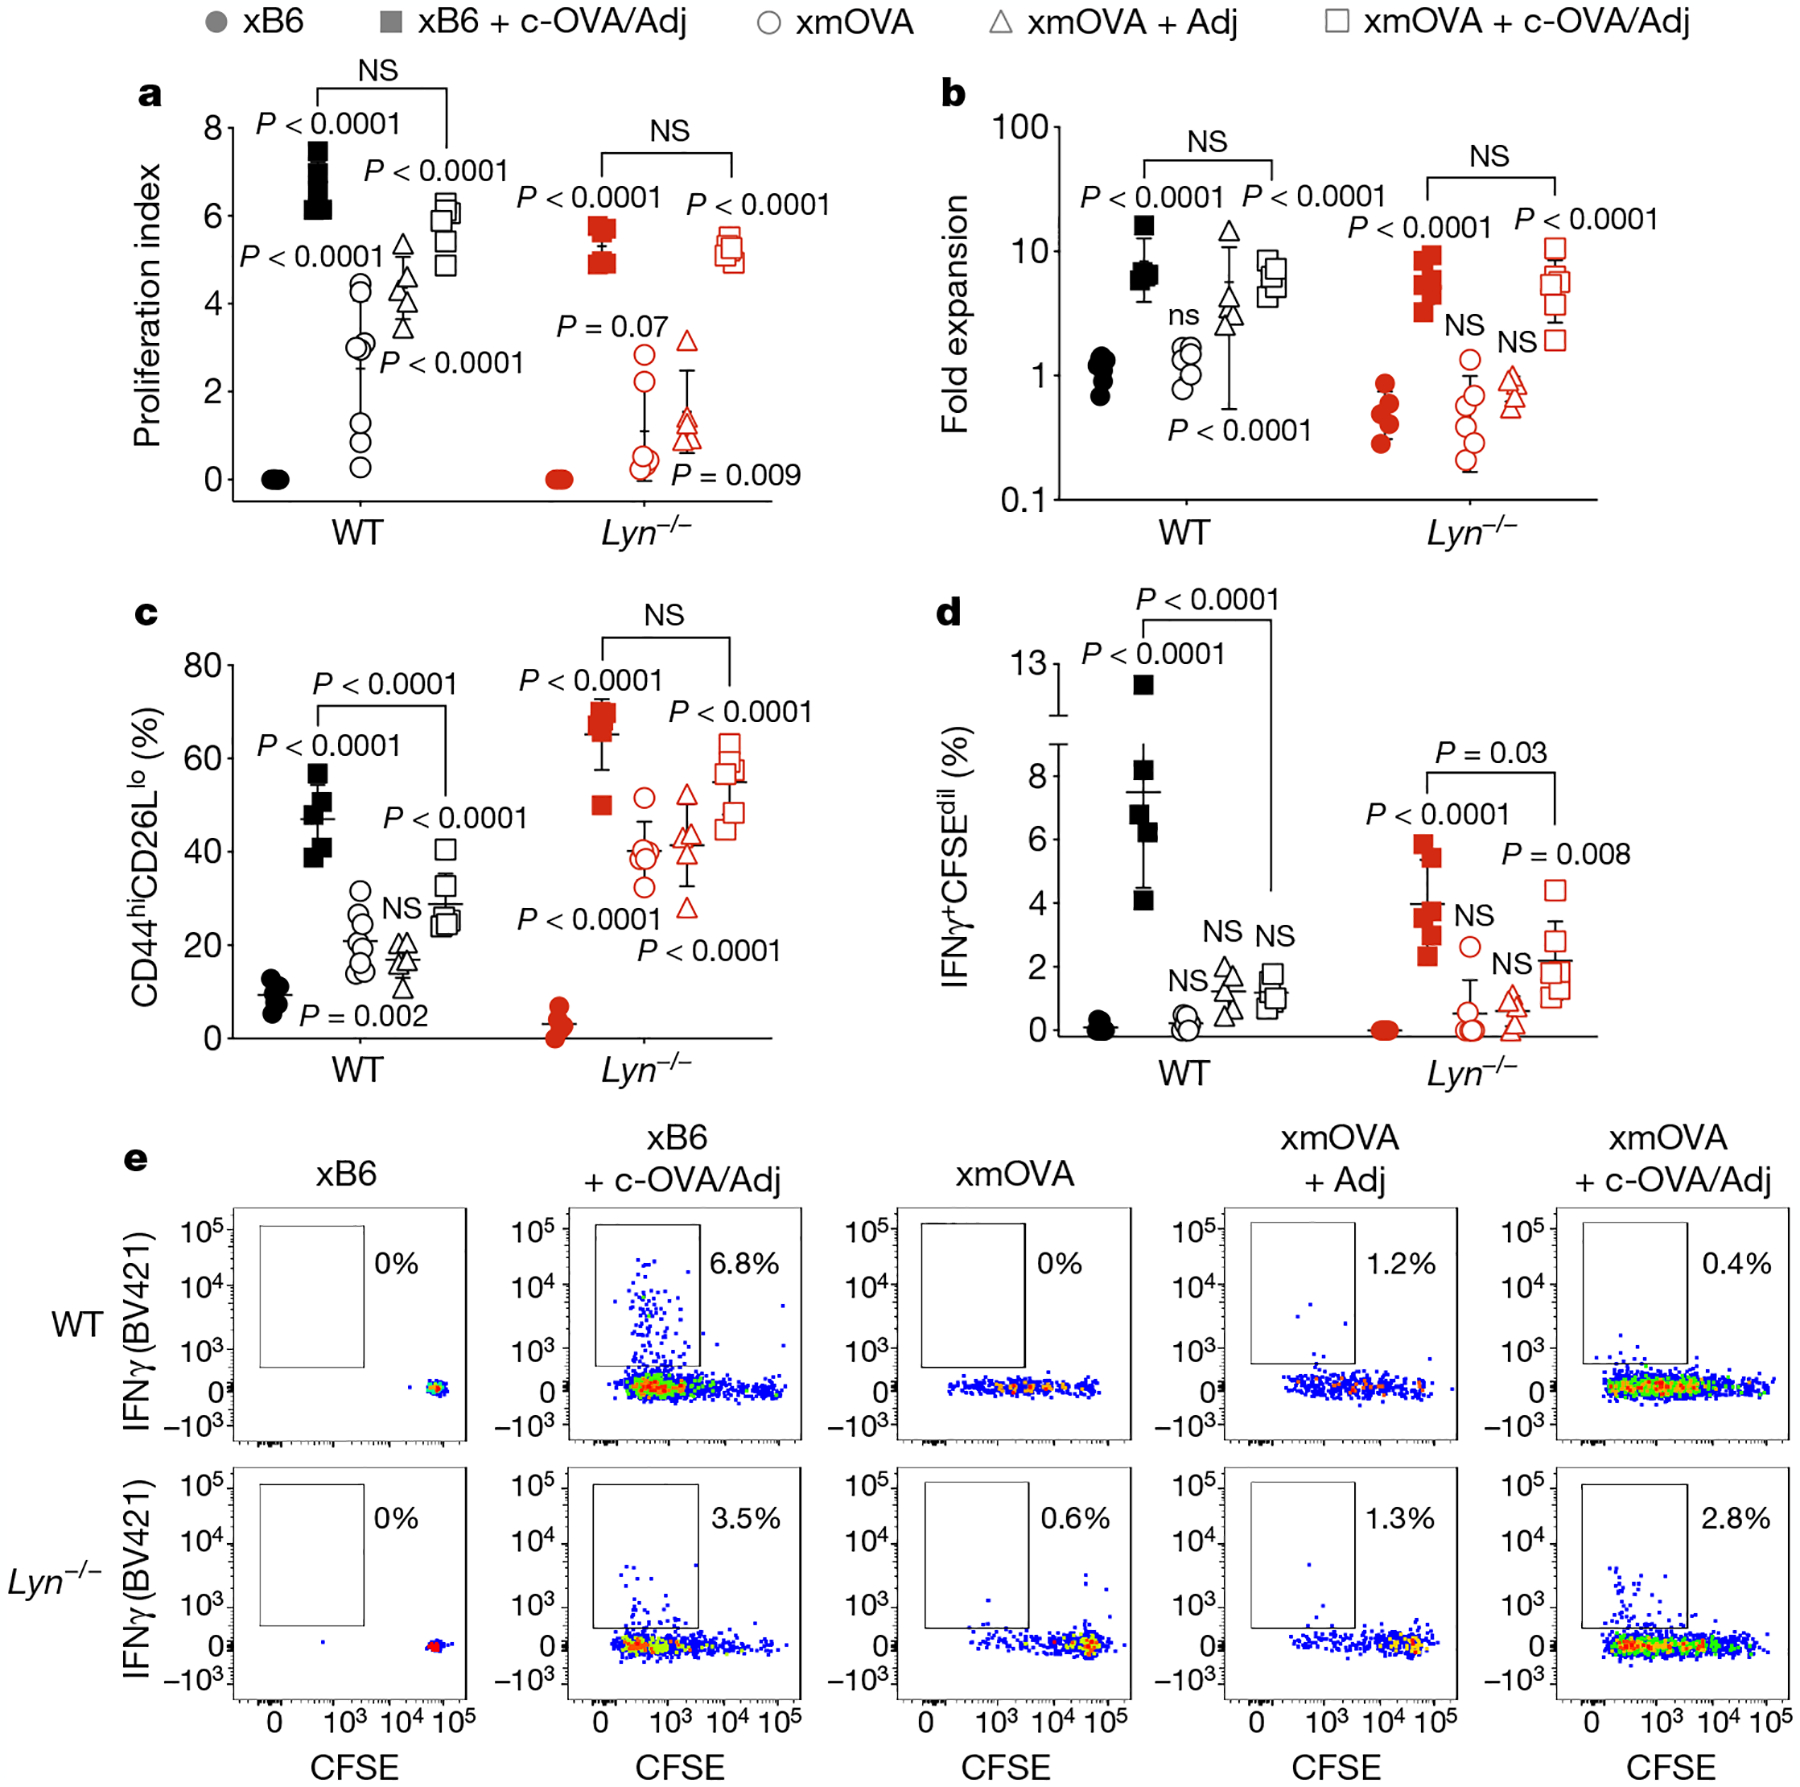
Fig. 4 |. CD4+ T-cell priming to t-mOVA in Lyn−/− mice.

a–e, Proliferation index (a), fold expansion (b), activation marker expression (c), IFNγ production (d) and representative flow plots (e) of CFSE-labelled OT-II cells 6 days after transfer on E12.5–15.5 cells into pregnant WT (top row, e) or Lyn−/− (bottom row, e) mice mated as indicated. Some groups received intravenous injections of adjuvants (poly(I:C) and anti-CD40 antibodies) with or without c-OVA at the time of OT-II transfer. Data for untreated WT xB6 and untreated WT xmOVA mice are the same as in Fig. 1. Adjusted P values were determined by ordinary one-way ANOVA with Sidkak’s multiple comparisons test as described in Fig. 1. Bars show mean ± s.d. Data were accumulated over eight independent experiments and all mice are displayed.
