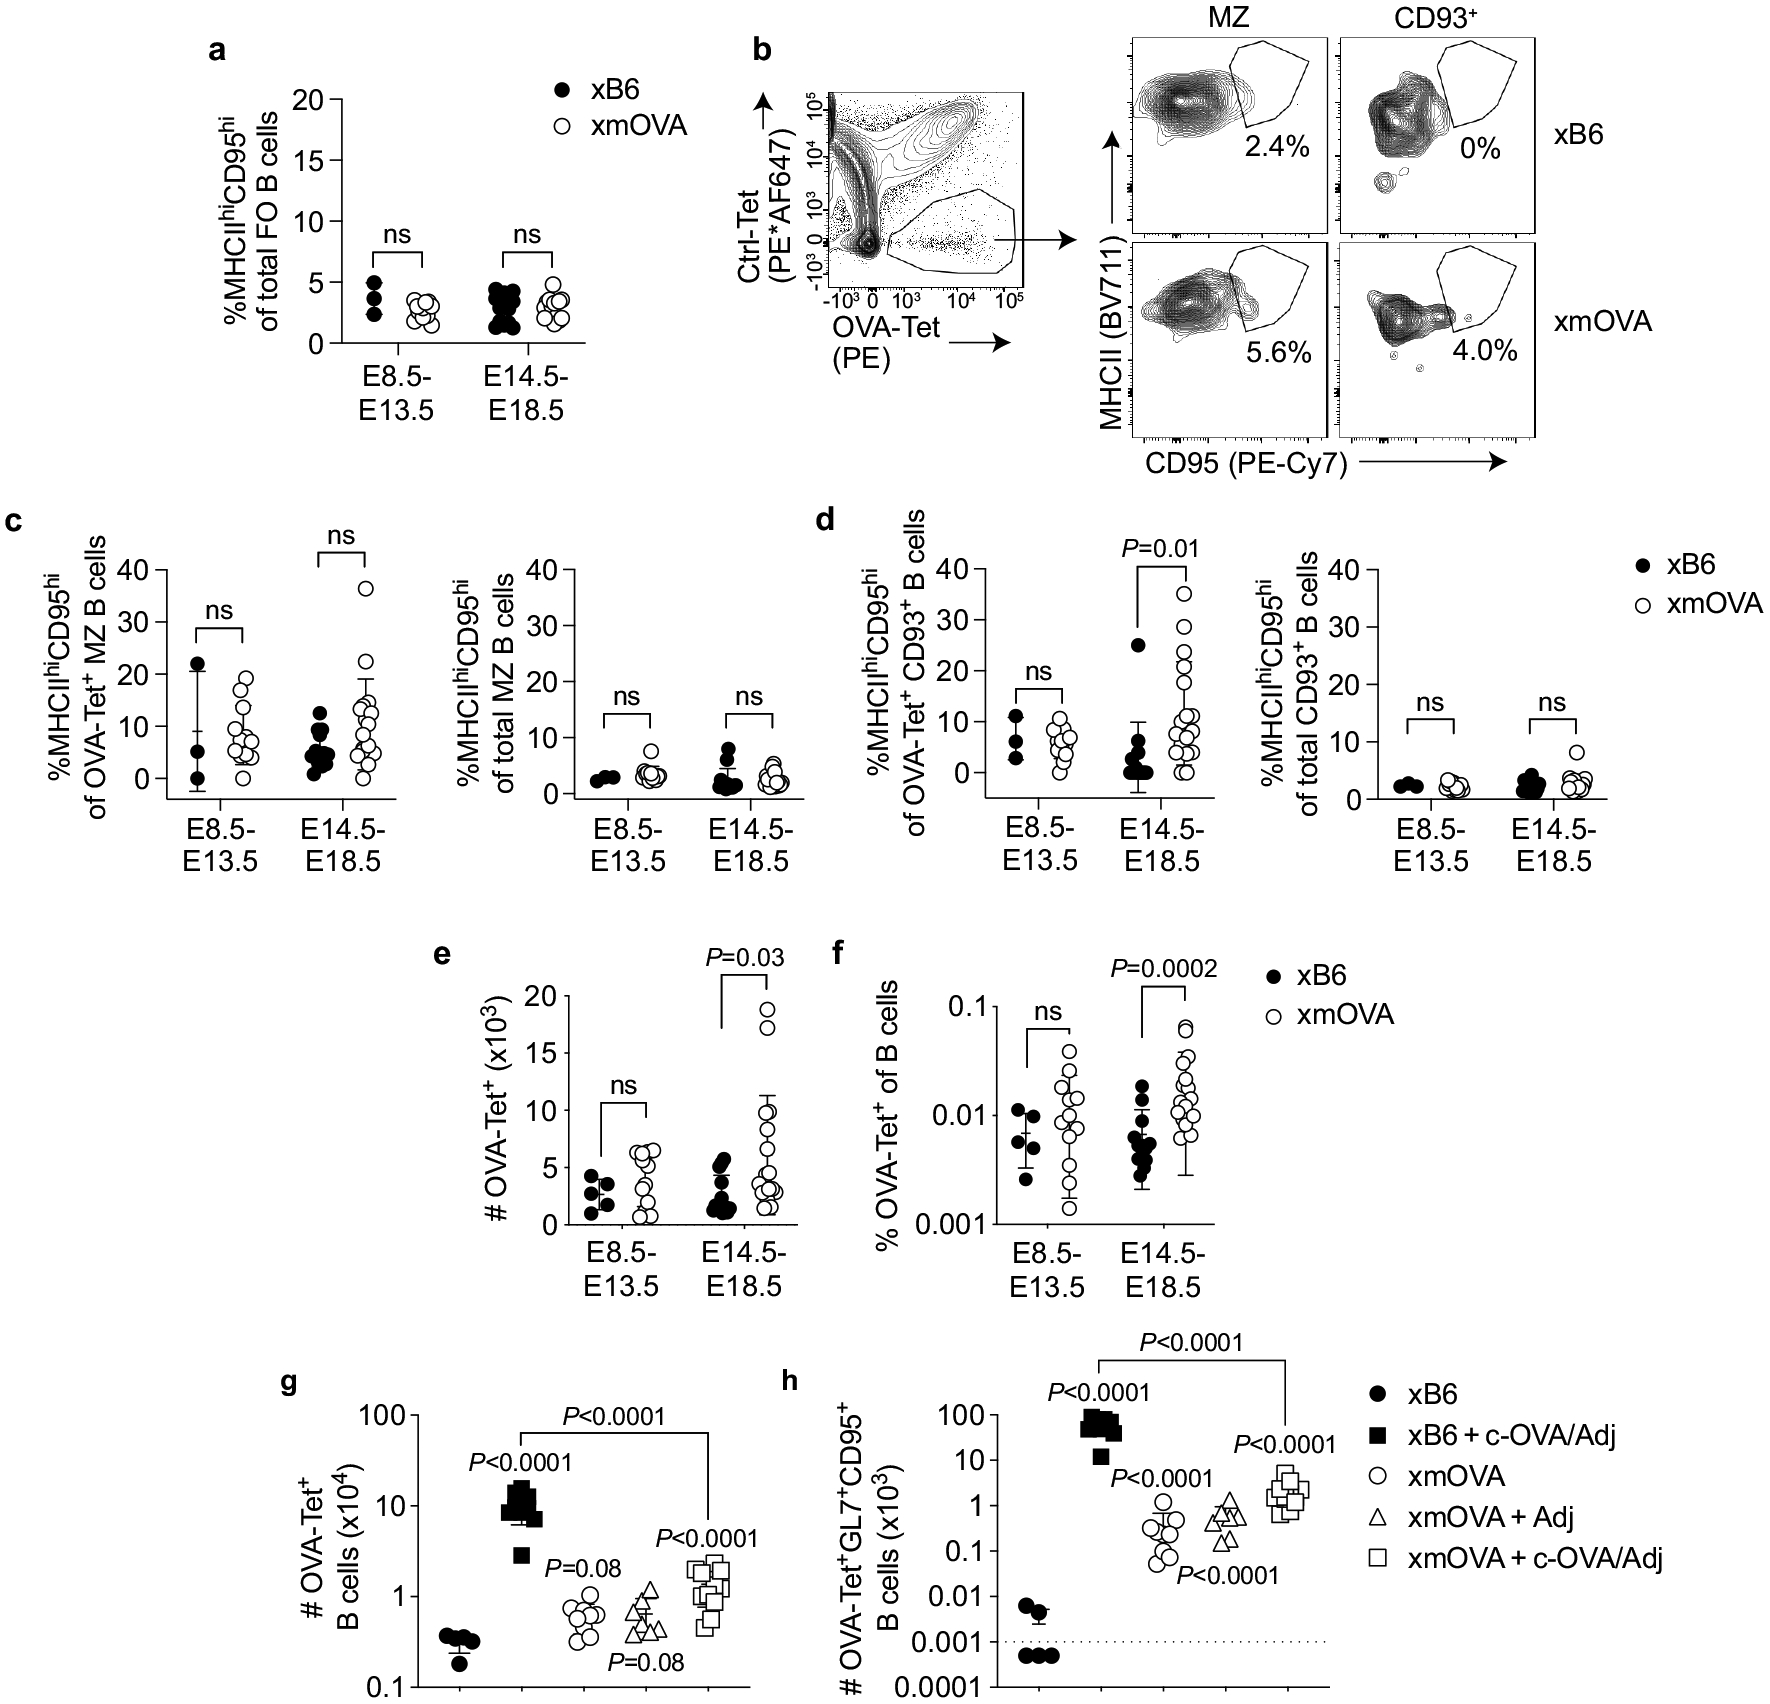
Extended Data Fig. 5 |. Antigen-specific B cell recognition of t-mOVA during pregnancy.

a, Total follicular (FO) splenic B cells from xB6 and xmOVA matings show a similar frequency of CD95hiMHCIIhi cells at mid (E8.5–13.5) and late gestation (E14.5–18.5), demonstrating that the increased frequency of CD95hiMHCIIhi cells among OVA-specific FO B cells in late gestation xmOVA mice (Fig. 2a, b) was antigen-driven. P-values were determined by two-tailed, unpaired t-test. Data were accumulated over 22 independent experiments and all mice are displayed. b–d, Phenotypic analysis of non-follicular splenic B cell subsets during mid- and late-gestation. Marginal zone (MZ) and CD93+ transitional splenic B cells were gated as DUMPnegCD19+IgMhiCD21/35hi and DUMPnegCD19+CD21/35lo/negCD93+ cells, respectively, and then assessed for CD95 and MHCII expression. b, Representative flow plots (E17.5) are from n = 13 xB6 and n = 17 xmOVA late gestation pregnancies. c, d, Quantification of CD95/MHCII expression from xB6 and xmOVA pregnancies. For OVA-specific (OVA-Tet+) cells, there was variable but significant t-mOVA-driven CD95/MHCII upregulation at late gestation (E14.5–18.5) in CD93+ but not MZ B cells (left graphs). This upregulation was much less dramatic than that seen for follicular B cells (Fig. 2b). A similar frequency of CD95hiMHCIIhi cells was seen for the total population of CD93+ and MZ B cells in xB6 and xmOVA pregnancies (right graphs). P-values were determined by two-tailed, unpaired t-test. Bars show mean±s.d. Data were accumulated over 22 independent experiments and all mice are displayed. e, f, OVA-specific (OVA-Tet+) B cells slightly expand in late gestation in xmOVA pregnancies. An increase in the absolute number (e) and frequency (f) of OVA-specific B cells becomes evident in late gestation (E14.5–18.5) only in xmOVA pregnancies. P-values were determined by two-tailed, unpaired t-test. Data were accumulated over 22 independent experiments and all mice are displayed. g, h, Antigen-specific B cell suppression by t-mOVA. Absolute number of total (g) or CD95+GL7+ GC phenotype (h) OVA-specific B cells 6 days after i.v. vaccination with 5×10⁴ OT-II cells ± c-OVA ± poly(I:C) (Adj) on E11.5 or E12.5. Padj Adjusted P-values were determined by ordinary one-way ANOVA with Šídák’s multiple comparisons test. Each group was compared to the xB6 control group, and the xB6+c-OVA/Adj group was compared to the xmOVA+c-OVA/Adj group. Bars show mean±s.d. The dashed line (h) indicates the limit of detection. This analysis employed the same samples used for Fig. 2c, d. Data were accumulated over 26 independent experiments and all mice are displayed.
