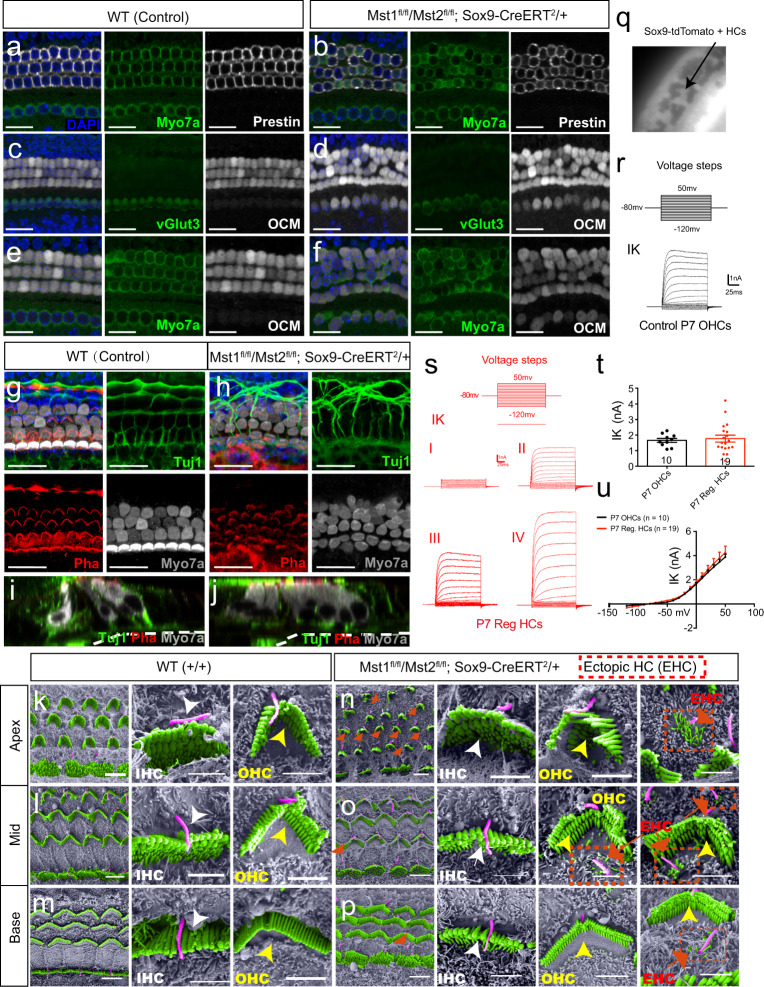
Fig. 4. The supernumerary HCs induced by YAP nuclear translocation are functional but immature in vivo.
a–f The supernumerary ectopic HCs in Mst1fl/fl/Mst2fl/fl; Sox9-CreERT2/+ mice were stained with the IHC marker vGlut3 and the OHC marker Prestin. Compared with WT mice, the newly generated HCs were labeled with OCM despite being located in the IHC and OHC region. g Phalloidin was used to label the stereocilia structure, and Tuj1 was used to label the nerve fiber. A “V”-shaped structure in OHCs and a “–”-shaped structure in IHCs labeled by phalloidin were observed and surrounded by orderly nerve fiber connections that were labeled by Tuj1 in P7 control mice. h In P7 Mst1fl/fl/Mst2fl/fl; Sox9-CreERT2/+ mice, almost all HCs—including regenerated HCs—had similarly shaped “V” and “–” structures labeled by phalloidin in the OHCs and IHCs, respectively. Tuj1 labeling showed 1–2 rows of inner HCs and 3–5 rows of outer HCs surrounded by irregular nerve fibers. i, j The sectional views of phalloidin and Tuj1 staining in control and transgenic mice at P7. k–m The representative view of ciliary structures from the apical to basal turn of the organ of Corti in WT mice under an electron microscope. n–p In littermate P7 Mst1fl/fl/Mst2fl/fl; Sox9-CreERT2/+ mice, immature hair bundles were detected with a decrease from the apical to basal turn. The enlarged views of IHC and OHC bundles in situ in control and Mst1/2 knockout mice and the immature ectopic hair bundles with slightly longer microvilli and a kinocilium from the apical to basal turn are shown on the right. q Mst1fl/fl/Mst2fl/fl; Sox9-CreERT2/+; Rosa26-tdTomato/+ mice were used to conduct the patch-clamp experiment. After tamoxifen injection at P1-2, cochleae were harvested at P7, thus the Sox9-tdTomato+ HCs could be observed under a microscope. r Representative outward K+ currents of WT P7 OHCs evoked by the voltage steps shown above. s Representative outward K+ currents of regenerated HCs in transgenic mice evoked by the same voltage steps shown above. t Mean ± SEM IK (Delayed rectifier potassium current) in response to 0 mV depolarization of WT P7 OHCs (n = 10) and regenerated HCs (n = 19). u Mean ± SEM peak current–voltage relations of WT P7 OHCs and regenerated HCs. Data are shown as the mean ± SEM. Scale bars = 20 μm in (a–f, g, h). Scale bars = 5 μm in the low magnification and 2 μm in the high magnification, respectively in (k–p).

