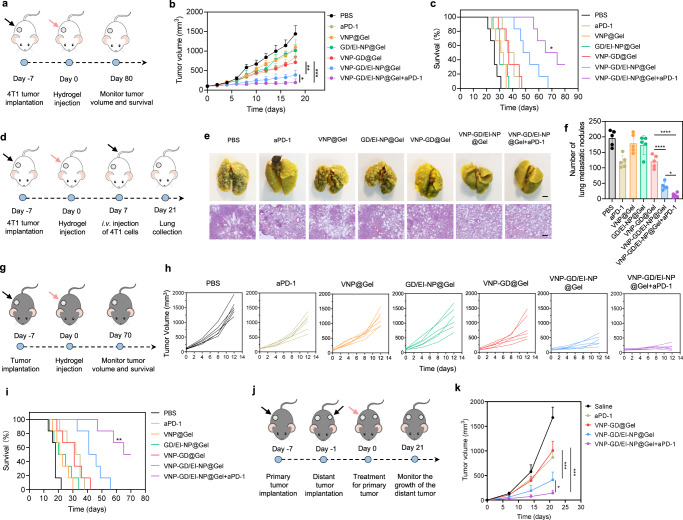
Fig. 4. Antitumor efficacy in 4T1 metastatic triple-negative breast cancer models and B16F10 melanoma models.
a Schematic illustration of the establishment and treatment strategy in 4T1 breast tumor model. b 4T1 tumor growth curves after different treatments. Data are presented as mean ± s.d. (n = 6 mice) and analyzed with two-way ANOVA followed by Tukey’s multiple comparisons test. VNP-GD/EI-NP@Gel+aPD-1 vs. VNP-GD/EI-NP@Gel: *P = 0.0259; VNP-GD/EI-NP@Gel vs. VNP-GD@Gel: **P = 0.0046; VNP-GD@Gel vs. VNP-GD/EI-NP@Gel+aPD-1: ***P = 0.0001. c Survival curve of the 4T1 tumor-bearing mice after different treatments (n = 6 mice). Data are analyzed with Log-rank (Mantel-Cox) test. VNP-GD/EI-NP@Gel vs. VNP-GD@Gel: **P = 0.0085; VNP-GD/EI-NP@Gel+aPD-1 vs. VNP-GD@Gel: ***P = 0.0005; VNP-GD/EI-NP@Gel+aPD-1 vs. VNP-GD/EI-NP@Gel: *P = 0.0308. d Schematic illustration of the establishment and treatment strategy of the breast tumor lung metastasis model. e Representative lung images and H&E assay after different treatments (n = 5 mice, scale bar = 2 mm for lung tissue images and 200 µm for H&E staining images). f Number of surface lung metastatic nodules in different treatment groups. Data are presented as mean ± s.d. (n = 5 mice) and analyzed with one-way ANOVA followed by Tukey’s multiple comparisons test. VNP-GD/EI-NP@Gel vs. VNP-GD@Gel: ****P < 0.0001; VNP-GD/EI-NP@Gel+aPD-1 vs. VNP-GD/EI-NP@Gel: *P = 0.0478. g Schematic illustration of the establishment and treatment strategy in B16F10 melanoma model. h B16F10 tumor growth curves after the same treatment regimen described above (n = 6 mice). i Survival curve of the B16F10 tumor-bearing mice after the same treatment regimen described above (n = 6 mice). Data are analyzed with Log-rank (Mantel-Cox) test (n = 6 mice). VNP-GD/EI-NP@Gel vs. VNP-GD@Gel: *P = 0.0173; VNP-GD/EI-NP@Gel+aPD-1 vs. VNP-GD@Gel: ***P = 0.0005; VNP-GD/EI-NP@Gel+aPD-1 vs. VNP-GD/EI-NP@Gel: **P = 0.0031. j Schematic illustration of the establishment and treatment strategy of the B16F10 double tumor model. k Distant tumor growth curves after different treatments as described above. Data are presented as mean ± s.d. (n = 6 mice) and analyzed with two-way ANOVA followed by Tukey’s multiple comparisons test. VNP-GD/EI-NP@Gel vs. VNP-GD@Gel: ***P = 0.0004; VNP-GD/EI-NP@Gel+aPD-1 vs. VNP-GD/EI-NP@Gel: *P = 0.0187; VNP-GD@Gel vs. VNP-GD/EI-NP@Gel+aPD-1: ***P = 0.0001. Source data are provided as a Source Data file.

