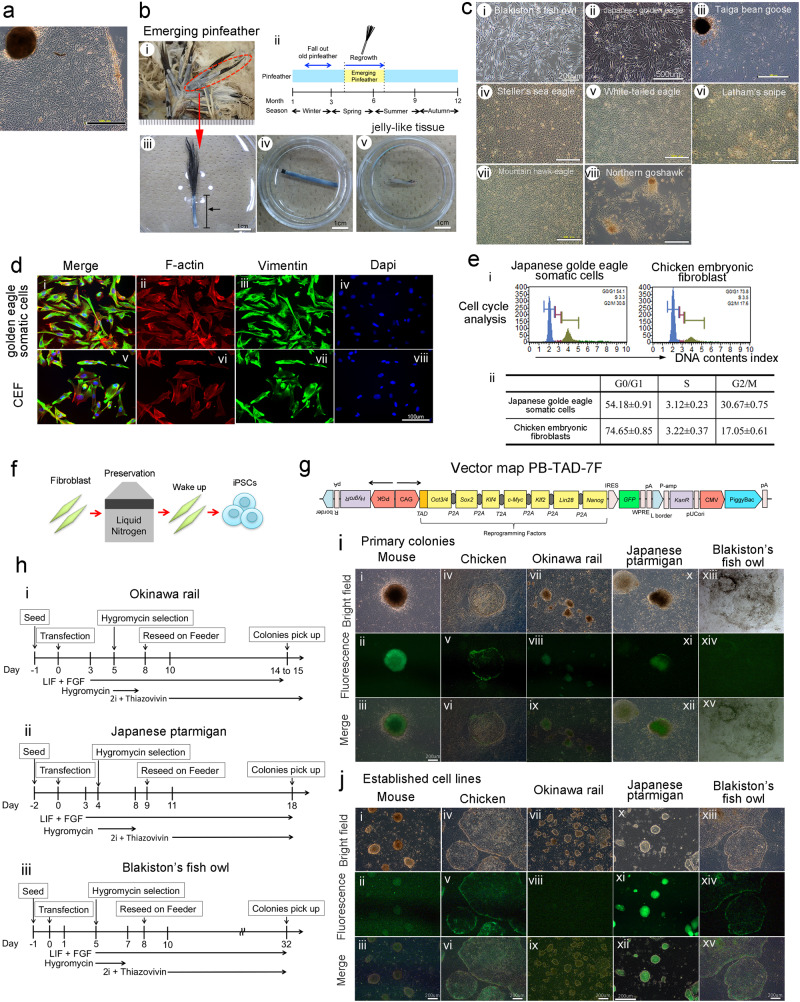
Fig. 1. Collection of somatic cells from Japanese endangered avian species and establishment of iPSCs derived from Japanese endangered avians, chicken, and mouse.
a Cell morphology of Okinawa rail-derived primary fibroblasts from the muscle tissue. The bars represent 500 μm. b Collection of somatic cells from emerging pinfeathers, and the cycle of pinfeathers of Japanese golden eagle and sampling point. Japanese golden eagle-derived pinfeathers (i). The cycle of emerging pinfeathers of Japanese golden eagle from late spring to early summer during one year, and sampling point (ii). Japanese golden eagle-derived pinfeathers (iii). The arrow indicates the feather sheath of the emerging pinfeather. Emerging pinfeathers after trimming for cell culture (iv). Jelly-like tissues were obtained from the inside of the emerging pinfeather (v). The bars represent 1 cm. c Somatic cells from the pinfeathers of wild avian species. Blakiston’s fish owl (i), Japanese golden eagle (ii), Taiga bean goose (iii), Steller”s sea eagle (iv), White-tail eagle (v), Latham’s snipe (vi), Mountain hawk-eagle (vii), and Northern goshawk (vii) derived somatic cells. The names of the avian species are presented in each image. The bars represent 200 μm (Blakiston’s fish owl) and 500 μm (other avian species). d F-actin and vimentin staining of Japanese golden eagle and chicken primary cells. Primary cells from the Japanese golden eagle pinfeather (i–iv) and chick embryo fibroblasts are displayed (v–viii). Merged (i and v), F-actin-stained (ii and vi), vimentin-stained (iii and vii), and DAPI stained (iv and viii) images are shown. Bars indicate 100 μm. e Cell cycle analysis of primary cells from Japanese golden eagles and chicken embryos. Somatic cells from the emerging pinfeather of a Japanese golden eagle and chick embryonic fibroblasts (i). Cell cycle ratio of Japanese golden eagle somatic cells and chicken embryonic fibroblasts (ii). The reported data of the table were the mean values ± S.D. f Experimental procedure used to establish Okinawa rail, Japanese ptarmigan, and Blakiston fish owl-derived iPSCs. Somatic cells derived from the endangered birds were collected, and preserved in liquid nitrogen tanks. g Vector map of the PB-TAD-7F reprogramming vector. h Establishment of Okinawa rail (i), Japanese ptarmigan (ii), and Blakiston fish owl (iii) iPSCs. We established iPSCs from Okinawa rail, Japanese ptarmigans and Blakiston fish owl somatic cells according to this flow. i Morphologies of primary colonies of iPSCs derived from mouse, chicken, Okinawa rail, Japanese ptarmigan, and Blakiston’s fish owls. Bright field images (i, iv, vii, x, and xiii), green fluorescence protein (GFP) images (ii, v, viii, xi, and xiv), and merged images (iii, vi, ix, xii, and xv) represent in this image. Mouse images (i–iii), chicken images (iv–vi), Okinawa rail images (vii–ix), Japanese ptarmigan images (x–xii), and Blakiston’s fish owl images (xiii–xv). The bars represent 200 μm. j Cell morphology of established iPSC lines derived from mouse, chicken, Okinawa rail, Japanese ptarmigan, and Blakiston’s fish owl. Bright field images (i, iv, vii, x, and xiii), green fluorescence protein (GFP) images (ii, v, viii, xi, and xiv), and merged images (iii, vi, ix, xii, and xv) represent in this image. Mouse images (i–iii), chicken images (iv–vi), Okinawa rail images (vii–ix), Japanese ptarmigan images (x–xii), and Blakiston’s fish owl images (xiii–xv). The bars represent 200 μm. Those images shows the mouse iPSCs of day 6 at passage 2 show (i–iii), the chicken iPSCs of day 5 at passage 2 (iv–vi), the Okinawa rail iPSCs of day 3 at passage 3 (vii–ix), the Japanese ptarmigan iPSCs of day 4 at passage 9 (x–xii), and the Blakiston’s fish owl iPSCs of day 7 at passage 10 (xiii–xv).

