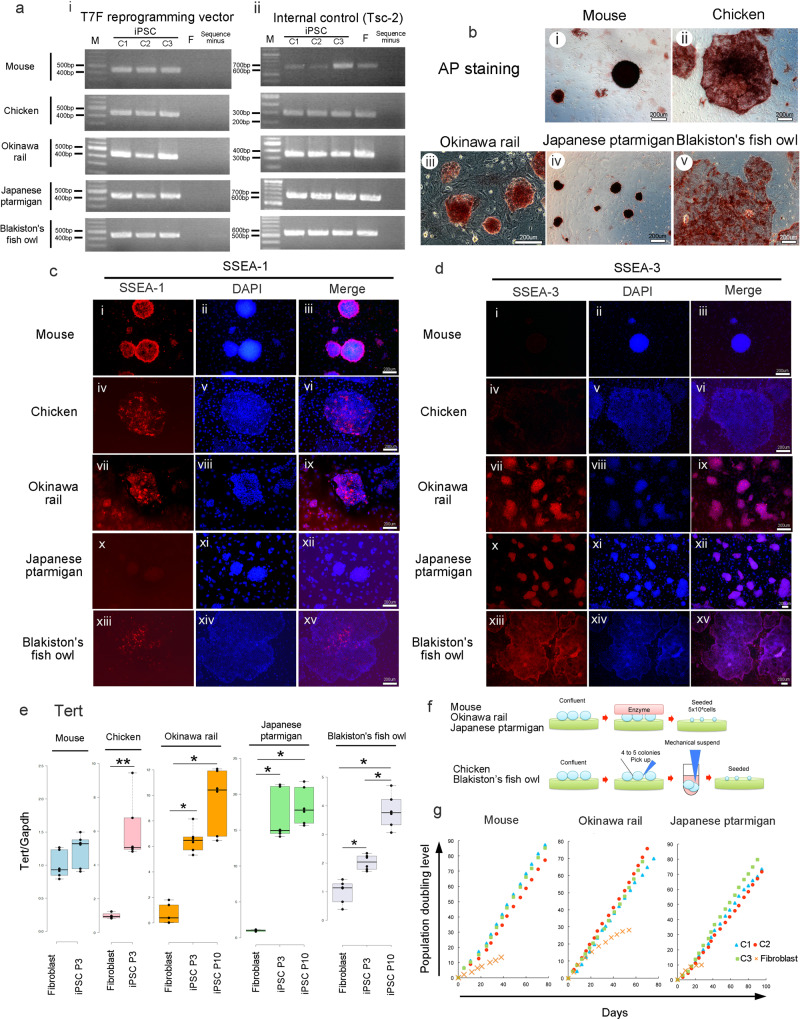
Fig. 2. Characteristics of the five iPSCs.
a Detection of reprogramming vectors using genomic PCR in mouse, chicken, Okinawa ral, Japanese ptarmigan, and Blakiston’s fish owl iPSCs. The PB-TAD-7F vector (i) and the Tsc2 internal control (ii) were detected. Lane M, molecular weight marker; lane C1, iPSC clone1, lane C2, iPSC clone 2; lane C3, iPSC clone 3; lane F, fibroblast; and lane sequence minus, PCR with sequence minus. b Detection of alkaline phosphatase (AP) activity in mouse (i), chicken (ii), Okinawa rail (iii), Japanese ptarmigan (iv) and Blakiston’s fish owl (v) iPSCs. The bars represent 200 μm. Detection of stage-specific embryonic antigen (SSEA)-1 (c) and -3 (d) in mouse, chicken, Okinawa rail, Japanese ptarmigan, and Blakiston’s fish owl iPSCs. SSEA-1 (i, iv, vii, x, and xiii), DAPI (ii, v, vii, xi, and xiv) and merged (iii, vi, ix, xii, and xv) image represent in (c), SSEA-3 (i, iv, vii, x, and xiii), DAPI (ii, v, vii, xi, and xiv) and merged (iii, vi, ix, xii, and xv) image represent in (d). The bars represent 200 μm. e Detection of telomerase reverse transcriptase (Tert) expression by real-time PCR. Tert expression was quantified relative to the GAPDH internal control. The fibroblast expression level was 1.0. Light blue bars are mouse; pink bars are chicken; orange bars are Okinawa rail; light green bars are Japanese ptarmigan; and light purple bars are Blakiston’s fish owl-derived cells. Mouse and chicken: The bars represent fibroblasts and iPSCs (passage number 3; P3). Okinawa rail, Japanese ptarmigan, and Blakiston’s fish owls: bars represents fibroblasts, iPSCs (P3) and iPSCs (P10). Centerlines of box plots indicate medians; box limits indicate the 25th and 75th percentiles as determined by BoxPlotR (http://shiny.chemgrid.org/boxplotr/). n = 4 (chicken fibroblast), n = 6 (other). *P < 0.05, **P < 0.01. f Passaging of mouse, chicken, Okinawa rail, Japanese ptarmigan, and Blakiston’s fish owl-derived iPSCs. g Cell growth analysis of established mice, Okinawa rail, and Japanese ptarmigan-derived iPSCs. The blue triangles represent iPSCs clone 1, red circles represent iPSCs clone 2, green squares represent iPSCs clone 3, and orange circles represent fibroblasts. We seeded 5 × 10⁴ iPSCs or fibroblasts on the culture plate and harvested them when growth was confluent.

